0.2 3.04
0.4 3.16
0.6 3.36
0.8 3.64
1.0 4
0.0 3
Graph 1 area =
0.5 [ (3.25 + 3)/2 ] = 1.5625 = area of first trapezium
0.5 [ (4 + 3.25)/2 ] = 1.8125 = area of second trapezium
1.5625 + 1.8125 = 3.375
For Graph 1 the sum of the area of the two trapeziums gives a result of 3.375
By increasing the number of trapeziums we can gain a more accurate estimate of the area under the curve. Using the same curve I shall try 5 separate trapeziums as apposed to the previous 2.
Area of first trapezium = 0.2 [ (3 + 3.04)/2 ] = 0.604
Area of second trapezium = 0.2 [(3.04 + 3.16)/2 ] = 0.62
Area of third trapezium = 0.2 [(3.16 + 3.36)/2 ] = 0.652
Area of forth trapezium = 0.2 [(3.36 + 3.64)/2 ] = 0.7
Area of fifth trapezium = 0.2 [(3.64 + 4)/2] = 0.764
The sum of all the trapeziums and therefore the estimate for the area under the graphs is
0.604 + 0.62 + 0.652 + 0.7 + 0.764 = 3.34
The difference between the two results is a decrease of 0.035 from 3.375 to 3.34 with an increase of 2 to 5 trapeziums
Using technology I can increase the number of trapeziums
For the first graph you can see that there are 10 trapeziums to give a greater accuracy of the estimate of the area under the graph.
0.3005(1st) + 0.3025(2nd) + 0.3065(3rd) + 0.3125(4th) + 0.3205(5th) + 0.3305(6th) + 0.3425(7th) + 0.3565(8th) + 0.3725(9th) + 0.3905(10th) = 3.335
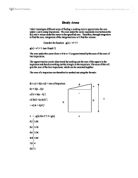
For the second graph you can see that there is only one trapezium and therefore the estimate of area below will be inaccurate.
½(3 + 4) x 1 = 3.5
1 trapezium = 3.5
2 trapeziums = 3.375
5 trapeziums = 3.34
10 trapeziums = 3.335
The more trapeziums the lower the result as it increases in accuracy and therefore decreases the amount of wasted, inaccurate, area data.
Therefore to find a general expression for the area under the curve of g, from x=0 to x=1 using n trapeziums I can use my data and previous methods to work out and test this method.
Having already discovered how to discover the area of one trapezium:
(b x c) + ½(a x d) = area of trapezium
1-0 1
width of each trapezium = n = n
let y0 = g(X0) , y1 = g(X1)…..etc
x=1
g(x) = width of each trapezium x height of each trapezium
x=0
= x ½
=
Substituting for y0 , y1 , …etc
x=1
g(x) =
x=0
=
The general statement that will estimate the area under any curve can be found as follows for y = f(x) from x = a to x = b using n trapeziums for
As above with width of trapezium =
= Width of each trapezium x height of each trapezium
= x ½
= x
Y1 = When n = 8 using the general formula
Therefore
= 1/8 x 15.8394
= 1.9799
Y2 =
= 1/8 x [y0 + 2y1 + 2y2 + 2y3 + 2y4 + 2y5 + 2y6 + 2y7 + y8]
Y3 =
Integration of these functions to find the precise areas under the curve gives the following results
5/3
Y1 = = (3/10) x
= 1.8721 – 0.3
= 1.5721
Y2 = = (9x/√(x³ + 9)) = ?
Y3 = m (4x³ - 23x² + 40x - 18)
= x^4 – (23/3)x³ + 20x² - 18x
= (81 – 207 + 180 – 54) - (1 - (23/3) +20 – 18)
= 0 – (-4.667)
= 4.67
(9x/√(x³ + 9))
(4x³ - 23x² + 40x - 18)
The first approximation was 15.6% off from the integrated answer while the third approximation was 7.7% off from the integrated answer. The third would be closer as the curve has a minima and maxima and, as the trapeziums overestimate with maxima and underestimates with curves with a minima, and so reduces the percentage error as it cancels it out.