Mathematics SL portoflio type 1(circles)
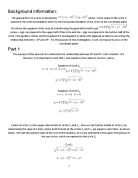
Background information: The general form of a circle is denoted by where r is the radius of the circle, k stands for the vertical translation and h for the horizontal translation of the circle on the coordinate plane. We derive the equation of the circle by transforming the general formula to get , where + sign corresponds to the upper half of the circle and the – sign corresponds to the bottom half of the circle. This equation will be used throughout the investigation to assist with algebraic problems concerning the relationship between r, OP and OP’. For the purpose of this investigation, O will correspond to (0,0) on the coordinate plane. Part 1 The purpose of this exercise is to determine the relationship between OP and OP’ with constant r of 1. However, it is important to note that r only implies to the radius of circles C1 and C3. Equation of circle C2 Equation of circle C1 Centre of circle C3 is the upper intersection of circles C1 and C2 , thus we can find the middle of circle C3 by determining the value of x and y where both formula of the circles C1 and C2 are equal to each other, as shown below. We take the positive value of the root of the equation, as we are interested in the upper intersection of the two circles, which corresponds to the circle C1. C2=C1 ; The coordinate of midpoint of circle C3 is From the midpoint of triangle C3, we can
This assignments purpose is to investigate how translation and enlargement of data affects statistical parametersI
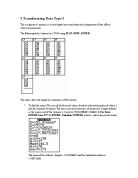
3 Transforming Data Type I This assignment’s purpose is to investigate how translation and enlargement of data affects statistical parameters. The following data I entered in a TI-84 using STAT: EDIT: ENTER This table shows the height in centimeters of 60 students. . To find the mean (The sum of all observed values divided by the total number of values.) and the Standard deviation (The most used of all measures of dispersion. Simply defined as the square root of the variance.), I used my TI-84 (STAT: CALC: 1-Var Stats: ENTER: List: 2ND: 2: ENTER: Calculate: ENTER), which is shown the picture below The mean of the student’s hieght is 152.9166667 and the standard deviation is 17.08731661. . a) To find the mean and the standard deviation, if I added 5 cm to each height I would first have to add 5 cm to each height which is shown in the table below: Then, repeating the steps I used on the first question using my TI-84 (STAT: CALC: 1-Var Stats: ENTER: List: 2ND: 2: ENTER: Calculate: ENTER) which gives me the following data: The mean and standard deviation of adding 5 cm to each height gives you 157.9166667 as the mean, and 17.08731661 as the standard deviation. b) To find the mean and the standard deviation if subtracting 12 cm from each height, I would first have to subtract 12 cm from each height which is shown in the table below: Then I would repeat the steps I

LACSAP Fractions. The aim of this portfolio is to discover an equation which suits the pattern of Lacsaps fraction using technology
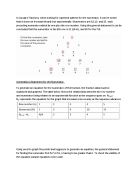
4/27/2012 ________________ LACSAP’S FRACTIONS Lacsap is backward for Pascal, therefore we can predict that the Pascal’s triangle can be applied in answering the following questions. The aim of this portfolio is to discover an equation which suits the pattern of Lacsap’s fraction using technology. The equation will have to consistently determine and follow the correct pattern for the numerator and denominator of each row. Finding the Numerator: The numerators in Lacsap’s fraction pattern follow the pattern of the third element of r=2 in Pascal’s triangle. Thus, the numbers with a circle in figure 1 are the same as the numerators in Lacsap’s fractions. Consequently, the equation used to represent the numerator can be: Numerator = n × (n+1) ‘n’ is the representation of the row number. ‘x’ is the unknown numerator of the sixth row To find the numerator of the sixth row we would replace ‘n’ with 6. (6) × (6+1) = x 3 × 7 = 21 x = 21 1 1 1 1 1 Plotting the Relation: The row number, which has been plotted up to the ninth row, is represented by the x-axis and the numerator by the y-axis. There is a parabolic curve to the plot. This means the numerator is increasing at a higher ratio than the row number. The sequences of the numerators are 3, 6, 10, and 15. When analyzed, we can see that the numerators are increasing one
Lascap Fractions. In Lacsap's Fractions, when looking for a general pattern for the numerator, it can be noted that it does not increase linearly but exponentially
In Lacsap's Fractions, when looking for a general pattern for the numerator, it can be noted that it does not increase linearly but exponentially. Numerators are 3,6,10, and 15, each preceding numerator added by one plus the row number. Using this general statement it can be concluded that the numerator in the 6th row is 21 (15+6), and 28 for the 7th. Generating a Statement for the Numerator: To generate an equation for the numerator of the fraction, the fraction data must be organized and graphed. The table below shows the relationship between the row number and numerator being relative to an exponential function as the sequence goes on. N(n+1)-Nn represents the equation for the graph that increases more evenly as the sequence advances. Using excel to graph the points and loggerpro to generate an equation, the general statement for finding the numerator N=0.5n2+0.5n, n having to be greater than 0. To check the validity of the equation sample equations were used: Sample Equation: 5th Row: N=0.5(5)2+0.5(5)=15 Patterns Recognized: The first pattern that could be recognized is that the difference between the numerators of the ensuing rows is 1 more than the change between the previous numerator of the two consecutive rows. The formula that represents the pattern of how to find the numerator is N(n+1)-N(n)=N(n)-N(n-1)+1. Using this method, the 6th and 7th rows can
Essay on Russells paradox and Incompleteness theorem
Neil Sanghrajka Essay on Russell’s paradox and Incompleteness theorem For me mathematics is like a tall building, and from time to time mathematicians create new floors of formulas and theorems. A new floor cannot be built without a previous floor, similarly in Mathematics new theorems rely on deductive reasoning using previous knowledge. Mathematics is an axiomatic system; these “truths” build the foundation of the field. However Russell’s paradox and the incompleteness theorem state that the very foundation of mathematics is inconsistent. Russell’s paradox shows an inconsistency in one of the axioms of the set theory. This example shows how mathematics fails the coherent truth test. The coherent truth test states that the premise for deductive reasoning must be logically consistent. Russell’s paradox gives an example of the incompleteness of mathematics. Gödel’s incompleteness theorem says that any axiomatic system cannot be complete and consistent at the same time. Using deductive reasoning, we may reach a point where a mathematical statement can neither be proved nor disproved. This is a simpler interpretation of the incompleteness theorem. To prove or disprove a statement, axioms are used in the proof. However if there is an inconsistency in the axiom itself, the proof can never be definite. An example is the set of all even natural numbers is infinite,

IB Math SL Portfolio Type 2 Population in China
IB Mathematics SL Math Portfolio (Type 2) Population Trends in China Candidate Name: Ishaan Khanna Candidate Session Number: 002603-011 Session: May 2012 The Doon School Index Introduction Variables Parameters Modelling the population of China Linear Quadratic Cubic Finding Equation analytically Researcher’s equation Implications Cubic model Researcher’s model Additional data Cubic model Researcher’s model Final model Original Data Conclusion Bibliography Introduction The aim in this portfolio is to study the different functions that best model the Chinese population from 1950 to 1995. The following table shows the population of China between 1950 and 1995: Year 1950 1955 1960 1965 1970 1975 1980 1985 1990 1995 Population in Millions 554.8 609.0 657.5 729.2 830.7 927.8 998.9 1070.0 1155.3 1220.5 Variables The significant variables in this analysis are ‘x’ and ‘y’. The variable ‘x’ is for the different years from 1950 to 1995 with 1950 as 0. The population in millions is represented by the variable ‘y’. Parameters The variables are time and population. Time (represented by x) cannot be negative and cannot decrease because it represents a unit of time.

Math IA Type 1 Circles. The aim of this task is to investigate the positions of points in intersecting circles.
Math IA (SL Type I)CirclesMariya Lupandina Aim: The aim of this task is to investigate the positions of points in intersecting circles. Introduction This investigation will examine the length of OP’ as it changes with different values of r and OP. A general statement will be deciphered to represent this relationship, using trigonometry, and the validity of this statement will be tested. In the first part of the investigation, r will be held constant, OP will vary and a general statement will be analytically developed. In the second part of the investigation, a general statement will be established for when OP is constant and r varies. Finally, in the third part of the investigation, technology will be used to test the two general statements developed in the first two parts, thus determining the general statement for OP’. For this investigation the following technology will be used: TI-Nspire Student Software, Geometer’s Sketchpad, and Microsoft Excel. Figure 1 shows circle C1 with the center O and radius r, and any point P. Figure 1 The circle C2 has center P and radius OP. Let A be one of the points of intersection of C1 and C2. Circle C3 has a center A and a radius r. The point P’ is the intersection of C3 with (OP). This is shown in Figure 2, below. Figure 2 It is observed that (OP) is the segment of line between the center of circle C1 and the center of
In this portfolio, I will determine the general sequence tn with different values of variables to find the formula to count the sum of the infinite sequence.
002329/ Anglo-Chinese School (Independent) INFINITE SUMMATION “I undersigned, hereby declare that the following course work is all my own work and that I worked independently on it” __________________ Name: Pranav Sharma _______________ Class: 5.16 Ephesians_______________ Index Number: ____________________________ Subject Teacher: ____________________________ Introduction . Technology used: . Microsoft word 2010 2. Microsoft Excel 2010 In this portfolio, I will determine the general sequence tn with different values of variables to find the formula to count the sum of the infinite sequence. ________________ . Let , therefore I will calculate the of the first 10 terms of the above sequence for After I calculated the sums for I am going to represent the relation between on a graph: n 1 1,693147 2 1,933373 3 1,988877 4 1,998495 5 1,999828 6 1,999982 7 1,999997 8 1,999998 9 1,999998 10 1,999998 From this graph we can see that as , the value of n increases as well, but it does not exceed 2, thus the greatest value of this relationship will be 2 and therefore the domain of this relationship is , as n approaches . 1. Let therefore the sequence of will look in the following way: After I calculated the sums for I am going to
Gold Medal Heights Maths Portfolio.
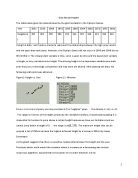
Gold Medal Heights The table below gives the data achieved by the gold medalists in the Olympic Games. Year 1932 1936 1948 1952 1956 1960 1964 1968 1972 1976 1980 Height(cm) 197 201 198 204 212 216 219 224 223 225 234 Using this data, I will create a model to represent the relationship between the high jump results and the years they took place. However, the Olympic Games did not occur in 1940 and 1948 due to World War 2. The independent variable is time, so let x-years be time and the dependent variable is height, so let y-centimetres be height. The winning height is the dependent variable since each year resources, technology, competition and may more are altered. After plotting the data, the following scatterplot was obtained: Figure1: Height vs. Year Figure1.1: Window Since x is in-terms of years, one may consider B.C as “negative” years. the domain is . The range is in-terms of the height jumped by the medalist therefore, theoretically speaking it is impossible for humans to jump above a certain height because we have our limitations and we cannot jump below a height of 0. the range is . The maximum height that can be jumped is set at 250cm because the highest achieved height by a human is 245cm by Javier Sotomayor. As the graph suggests that there is a positive relationship between the height and the year. Functions which could
Investigating types of logarithms
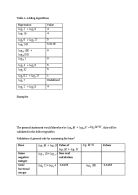
Table 1: Adding logarithms Expression Value + 4 4 + 5 5.0118 + 0 0 + 5 5 + 1 Undefined + 4 Examples The general statement would therefore be =, this will be validated in the following tables Validation of general rule by examining the base* Base Value of Values Same negative integer Non-real calculation Same fractional integer -6.6438 -6.6438 Same irrational interger 10 10 Different positive integer 4.2146 4.8613 3.7625 Zero Undefined Undefined *? is used to represent any value Validation of general rule through the examination of the number while keeping the bases the same positive integer Number Value of Value of Different positive integer 4.8613 4.8613 Same positive integer 4 4 1 Negative positive Non-real calculation Both negative integers Non-real calculation Different fractional integer -0.7075 -0.7075 Same fractional integer -0.4150 -0.4150 Additive Inverses i.e. 5 + (-5) = 0 Non-real calculation Different irrational number 0.7153 0.7153 Same irrational number 0.4306 0.4306 Number is 0 Undefined Number is 0 0 It is important to take note of the scope and limitations of the general statement, to find out in what condition the general statement does and does not work. = The base cannot be negative, must be above zero, but cannot equal to 1. The number cannot be negative, must be