
Gold Medal heights IB IA- score 15
International Baccalaureate Gold Medal Heights SL Math IA- Type II Turner Fenton Secondary School Completed by: Harsh Patel Student Number: 643984 IB number: Teacher: Mr. Persaud Course Code: MHF4U7-C Due Date: November 16th, 2012 Introduction This report will investigate the winning heights of high jump gold medalists in the Olympics. The Olympics composed of several events evaluating physical strength of humans. Every Olympic game brings different numerical value for a height that a person can jump, allowing for different data collection. First of all, the data ranging from the years 1932 to 1980 will be portrayed on a graph for observation. From thorough investigation, the best curvature or line that fits the trend of the data will be selected to represent the relation. The function will be algebraically approached using the numerical values of the data points. Through the use of technology, the parameters will be plugged in to illustrate that function electronically. The function will be observed and any limitations with the model will be indicated. The function might need refinement according to any outliers/ anomalies, also to better represent the trend. The model function and a given function by the programme will be compared. Since the Olympics were not held during the years 1940 and 1944 due to WWII, this function will help determine the possible outcomes
Circles Portfolio. The purpose of this assignment is to investigate several positions of points in three intersecting circles in order to discover a general statement
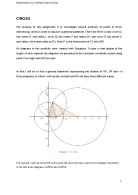
Mathematics SL, Portfolio Type 1Circles CIRCLES The purpose of this assignment is to investigate several positions of points in three intersecting circles in order to discover a general statement. There are three circles: circle C1 has center O and radius r, circle C2 has center P and radius OP, and circle C3 has center A and radius r (the same radio as C3). Point P' is the intersection of C3 with (OP). All diagrams in this portfolio were created with Geogebra. To give a clear display of the length of each segment the diagrams are presented in the Cartesian coordinate system using point O as origin and (OP) as x-axis. At first I will try to find a general statement representing the relation of OP’, OP and r in three examples, in which r will remain constant and OP will have three different values. Diagram 1: r=1, OP=2 The method I will use to find OP’ will include the cosine function used in two triangles I will sketch in the first three diagrams: and. In diagram 1: Triangle OPA Triangle OP’A a₁=OP=2 a₂=OP’=? o= PA=2
Math IA patterns within systems of linear equations
Math HL Investigation – Maximilian Stumvoll Math HL Investigation Patterns within Systems of Linear Equations Maximilian Stumvoll 1/11/2012 LIS ________________ Part A We consider this 2 x 2 system of linear equations: x+2y=3 2x-y=-4 Looking at the coefficients in the first equation (1, 2, 3) we notice a pattern. Adding 1 to the coefficient of x (1) gives the coefficient of y (2) and adding 1 once more gives the constant (3).A similar pattern exists in the second equation. Only, here we add -3 to the coefficients. We can say the coefficients follow an arithmetic sequence (AS). An arithmetic sequence has a common difference (d). This is the difference between two consecutive terms of the sequence. The first equation has a first term (a) of 1 and a common difference (d) of 1. The second equation has a first term (b) of 2 and a common difference (e) of -3. In order to solve this system of equations with the method of solving simultaneous equations by elimination, we need to multiply the first equation by 2. Then we can subtract the second equation from the first equation: As proof we can solve the simultaneous equations by the method of substitution. Rewriting the first equation as and substituting for x in the second equation gives: . This we can solve for y: Substituting this y-value into the second equation gives: Solving for x gives: Therefore the

Mathematic SL IA -Gold medal height (scored 16 out of 20)
Mathematics Standard Level Portfolio Type 2- gold medal height Candidate name: Sun Ha (Rucia). Park Candidate number: School: Beijing No.55 High School ________________ Content Introduction ________________ Introduction Olympic Game is a variety competition of various athletics. It is composed twice a year, summer and winter, and it is hold once four year. Because there are many athletics competitions, it’s a great opportunity to take numerical data. In this task, I will investigate the winning height for the men’s high jump in the Olympic Games. The high jump is a track and field athletics plays in which athletes jump over a horizontal bar placed at measured heights without any aid of certain devices. I m going to use Microsoft Excel and the graphing calculator TI-84 to collect and present the data for analysis and investigation, and find out the best –fit functional curve to the original data. The table has given the original numerical data of the height achieved by the gold medalists at various Olympic Games. Year 1932 1936 1948 1952 1956 1960 1964 1968 1972 1976 1980 Height (cm) 197 203 198 204 212 216 218 224 223 225 236 Depending on the data, I will investigate this case by setting time of Olympic for my independent variable, and setting the winning height for my dependent variable. In graphs I will show, I let x denote

Mathematic SL IA -Circles (scored 17 out of 20)
Mathematics Standard Level Portfolio Type 1- Circles Candidate name: Sun Ha (Rucia). Park Candidate number: School: Beijing No.55 High School ________________ INTRODUCTION In this task, I will investigate positions of points in intersecting circles. I will analyze and investigate the problem in two different situations with different conditions, to find a general statement that shows general situation of points in intersecting circles. I am going to use Microsoft word to analyze the task, an application called Geogebra to graph intersecting circles, and TI-84 graphing calculator to calculate the values. There are three circles intersecting. Circle 1(C1) has center O, Circle 2 (C2) has center P and Circle 3(C3) has center A. C1 has radius OP, and let A be the intersecting point of C1 and C2. C3 has its radius, r. The point P’ is the intersection of C3 with OP. Used knowledge: I have used 3 mathematical theorem, or rules to proof my findings. . Similar triangle theorem This theorem is used where two or more triangles with the same size angles. If the triangles are in the same shape with the same three (in fact, two) angles, then they are called similar triangles in different ratio. . The Pythagoras’s theorem Sides which are opposite to the angles are labeled using small alphabets of the angles. When angle B is 90°, which means the triangle is a right

Fishing rods type 2 portfolio
Math Portfolio Type II: Fishing Rods Introduction A fishing rod can only work well if there are numerous "guides" along the blank of the rod to guide the fishing lines. Having numerous "guides" along the blank of the rod provides greater castability, greater hooking power, and most importantly prevents the line from twisting and tangling up. A fishing rod without the "guides" would have little use since the lines will most likely tangled up before it even enters the water. In this portfolio, I would have to develop a mathematical model for the effective placement of line guides on a fishing rod. A mathematical model for the placement of line guides on a fishing rod has many applications in the real world. One of the main benefits would be helping fishing rod companies in placing their "guides" in the most optimal positions so the rod can function better than their competitors. The fishing rod that I would have to develop a model on would be Leo's fishing rod. Leo's fishing rod is 230cm long and has eight guides along it with a ninth at the very tip of the rod. The table below shows the values for the distance for each of the line guides from the tip of the fishing rod on Leo's rod. Table 1: The relationship between the # of guides and the distance from tip (cm) Guide number 1 2 3 4 5 6 7 8 Distance from tip 10 23 38 55 74 96 120 149 Part A: Variables

Modelling the H1N1 Epidemic in Canada
IB Maths SL Internal Assessment | Tanya Waqanika CITY AND ISLINGTON SIXTH FORM COLLEGE IB Maths SL Internal Assessment Modelling the re-emerging H1N1 virus in Canada Tanya Waqanika Table of Contents Rationale Background Epidemiology The SIR Model The SIR Model’s Differential Equations The S – Susceptible equation An Alternative Method for Plotting the SIR model on a Graph Applying the SIR Model to the Re-Emerging H1N1 virus in Canada The Basic Reproductive Number and β Applying the Calculated Values from the data on the SIR Model Vaccination and Herd Immunity with the Basic Reproduction Number Conclusion and Reflection Appendices Appendix 1 – Excel data used to produce Graph 2 Appendix 2 – Model, Graph and Calculations for Graph 3 Bibliography Rationale As I would like to study Medicine in the future, I decided to investigate the mathematics of epidemiology. Epidemiology is also interesting to me because the constant and fast evolution of dangerous pathogens and diseases often threatens the human population. In the last few decades alone, epidemics such as AIDs, Measles, Avian Influenza (H5N1) and Swine Influenza (H1N1 (pdm09)) have caught the attention of the world. 2009 was a particularly significant year, as a
The Koch Snowflake
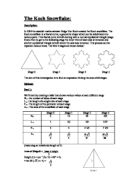
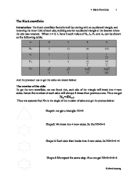
The Koch Snowflake: Description: In 1904 the swedish mathematician Helge Von Koch created the Koch snowflake. The Koch snowflake is a fractal curve, a geometric shape which can be subdivided into various parts. This fractal curve is built starting with a normal equilateral triangle (stage 0) and then to get to the following stage the inner third of each side is removed and another equilateral triangle is built where the side was removed. This process can be repeated various times. The first 4 stages are shown below: Stage 0 Stage 1 Stage 2 Stage 3 The aim of this investigation is to find an expression linking the area of all stages. Method: Part 1: We'll start by creating a table that shows various values at each different stage N n = the number of sides of each stage L n = the length of a single side of each stage P n = The length of the perimeter of each stage A n = The area of the snowflake of each stage Stage 0 Stage 1 Stage 2 Stage 3 N n 3 2 48 92 L n /3 /9 /27 P n 3 4 5 1/3 7 1/9 A n (Assuming an initial side length of 1) Area of Stage 0 = base x height 2 Height (h) = cos -1 (1/2 / 1) = 60º = 1/2 = tan 60 () x 1/2 = Area = = 2 Area of Stage 1 = Area of Stage 0 + Area of 3 shaded triangles

The Koch Snowflake
The Koch Snowflake IB Portfolio 1/21/2007 IB HL Math Year 1 Felipe F Fagundes The purpose of doing this investigation is so that we can learn about the different patterns that the Koch Snowflake presents. The simple fact of the Koch Snowflake is a fractal already says a lot about it. A fractal is a figure which repeats itself in smaller scales. For example if stage 12 was looked closer stage two would be found and so would be stage 3 and so on. In this investigation we explored the patterns that emerge from one stage to the other. We tried to find any patterns for when n= 0,1,2,3 that could be applied to find any other n term. We specifically looked for patterns in N= the number of sides, L= the length of one side, P= the total perimeter, and A= the total area. And in order to come up with these patterns we used many resources like drawing in order to prove that our results were accurate. - Using an initial side length of 1, create a table that shows the value of Nn , ln ,Pn , and An for n= 0, 1, 2, 3. Don't make decimal approximation; use exact values. n 0 2 3 N 3 2 48 92 L ,1-3. ,1-9. ,1-27. P 3 4 ,16-3. ,64-9. A ,,-3.-4. ,,-3.-3. ,10,-3.-27. ,94,-3.-243. N= I was able to come up with the number of sides (N) by counting the number of sides of the triangles in the drawing of the fractals. When I had to count the number of sides in stage 3 I
The Koch Snowflake
The Koch snowflake Introduction: The Koch snowflake fractal is built by starting with an equilateral triangle, and removing the inner third of each side, building another equilateral triangle at the location where the side was removed. When n = 0, 1, 2and 3 each value of Nn, ln, Pn and An can be shown as the following table: n 0 2 3 Nn 3 2 48 92 ln Pn 3 4 An And the process I use to get the value are shown below: The number of the side: To get the next snowflake, we can found that, each side of the triangle will break into 4 new sides, hence the number of each side will always 4 times than previous one. Thus we get Nn=4Nn-1 Thus we assume that Nn is the single of the number of sides and get the process below: Shape1: we get a triangle. N1=3 Shape2: We break into 4 new sides. So the N2=3×4 Shape 3: Each side then brake into 4 new sides, So N3=3×4 ×4 Shape 4:We repeat the same step, thus we get N4=3×4×4×4 And then we graph our data: The number of the side We can found that the shape of the graph is a geometric series. Thus, if we want to get the next shape, we should time the same number. Thus it's a geometric series which has a first term of 3 and a common ratio of 4, obviously. So we can get the geometric formula: Then, to verify the formula, we place n=0 n=1