
Logan's logo
Logan's Logo Abstract This internal assessment focuses on functions and areas under curves. The task at hand was to develop models of functions to best fit the characteristics/behaviours of the curve of Logan's logo. Using an appropriate set of axes data points of the curve were measured using a ruler and then identified and recorded. 11 data points were recorded for each curve. The main objective of this IA was to determine which model, cubic or sin, would be the best fit. It was observed that the cubic function was superior. Another task was to refine the model function to fit on a t-shirt and a business card. The area between the two curves had to be calculated. In doing this assignment many pieces of technology were incorporated when doing this assignment, ranging from a pencil and a ruler to calculators and even spreadsheets and other programs. Introduction: A diagram of a 10cm by 10cm square is divided into three regions by two curves. The logo is the shaded region between the two curves. This investigation is aimed at answering several questions but mainly to develop mathematical functions to model the two curves represented by the two curves. Some key terms that should be understood are: sin function, cubic function, MAE (Mean Absolute Error). These terms will be elaborated on later on this assignment. A few data points were taken from the curves, with the base

Math HL portfolio
Math HL Portfolio Patrick Vollmer Description: In this task you will investigate the patterns in the intersection of parabolas and the lines y=x and y=2x. Then you will be asked to prove your conjectures and to broaden the scope of the investigation to include other lines and other types of polynomials. The main aim of my investigation is to conclude an answer for the relations between the graph intersections of the graphs y=x and y=2x Method . Consider the parabola y=(x-3)²+2=x²-6x+11 and the lines y=x and y=2x. Using Technology find the four intersections illustrated on the right. Using the Microsoft based program autograph(r) the four intersections between the three given graphs were found. Label all the x-values of these intersections as they appear from left to right on the x-axis as , , and . ( Label on the actual graph) Find the values of - and - and name them respectievlyand . = {1,764} - = 2,382 - 1,764 = 0,618 = = {2,382} - = 6,236 - 4,618= 1,618 = = {4,618} = {6,236} Finally, calculate D = - D= - = 0,618 - 1,618 = - 1= 1 D = 1 2. Find Values for D for other parabolas of the form y=ax²+bx+c, a > 0, with vertices in quadrant 1, intersected by the lines y=x and y=2x. Consider various values of a, beginning with a=1. Make a conjecture about the value of D for

Modelling the H1N1 Epidemic in Canada
IB Maths SL Internal Assessment | Tanya Waqanika CITY AND ISLINGTON SIXTH FORM COLLEGE IB Maths SL Internal Assessment Modelling the re-emerging H1N1 virus in Canada Tanya Waqanika Table of Contents Rationale Background Epidemiology The SIR Model The SIR Model’s Differential Equations The S – Susceptible equation An Alternative Method for Plotting the SIR model on a Graph Applying the SIR Model to the Re-Emerging H1N1 virus in Canada The Basic Reproductive Number and β Applying the Calculated Values from the data on the SIR Model Vaccination and Herd Immunity with the Basic Reproduction Number Conclusion and Reflection Appendices Appendix 1 – Excel data used to produce Graph 2 Appendix 2 – Model, Graph and Calculations for Graph 3 Bibliography Rationale As I would like to study Medicine in the future, I decided to investigate the mathematics of epidemiology. Epidemiology is also interesting to me because the constant and fast evolution of dangerous pathogens and diseases often threatens the human population. In the last few decades alone, epidemics such as AIDs, Measles, Avian Influenza (H5N1) and Swine Influenza (H1N1 (pdm09)) have caught the attention of the world. 2009 was a particularly significant year, as a

Math IA - Logan's Logo
IBO INTERNAL ASSESMENT LOGAN'S LOGO MATHEMATICS SL TYPE II INTRODUCTION Logan has designed the logo at the right. The diagram shows a square which is divided into three regions by two curves. The logo is the shaded region between the two curves. He wishes to find mathematical functions that model these curves. In order to find these functions, we will need to overlay the logo on graph paper, so we can interpret data points to be able to plot them. Take note that in the "modeling the data" in the next section, the logo was not resized, but set as transparent so that data points could be read. Also, take into consideration the uncertainty of the measurements (± 0.25 units). For modeling purposes, the uncertainties are not included in the data calculations; however this should not be overlooked. MODELING THE DATA NOTE: Data tables and their graphs are included on the next page. TOP CURVE : In order to find a function to model the top curve, there are various methods that we can use. One is to overlay the logo onto a set of axes and estimate points for the function. Once we obtain these points, we can then plot them onto a new set of axes. Judging from the logo itself, at first glance it appears that a sine function would fit the data. The sine function would have to undergo a series of transformations to eventually fit the curve. Using the axes and logo depicted
Population trends. The aim of this investigation is to find out more about different functions that best model the population of China from 1950 to 1995.
Population Trends in China The aim of this investigation is to find out more about different functions that best model the population of China from 1950 to 1995. The controlled variables would be the place where the population was measured (China) and the amount of years between each reading (5 years every time the population is given). The dependant variable is the population in China and the independent variable would be the year at which the population was recorded. The parameters leading to the amount of Chinese people involve the family planning policy, this mean that from 1970 onwards, urban families would only be allowed to have one child. However the majority of the population would be exempt from the rule because they are either rural families, ethnic minorities or if either parent was a single child he or she would be allowed to have more than one child1. Fertility rate in China was 5 babies per woman until 1970, the new laws were implemented and there was a sharp reduction to 3 babies per woman in 1980. In 2008 the fertility rate was less than 2. The implementation of the restrictions helped the Chinese government to reduce an estimate of 400 million births since the policy was implemented. After the policy was implemented people in China looked for ways to only give birth to boys because they would be able to sustain the family, on the other hand girls wouldn't.
Investigating ratio of areas and volumes
Investigating Ratios of Areas and Volumes Michael Zuber Introduction: This paper has been separated into three parts: Part i investigates the ratio of the areas formed when y = xn is graphed between two arbitrary parameters x = a and x=b such that a<b. Part ii investigates the ratio of the volumes formed around the x-axis when y = xn is graphed between two arbitrary parameters x = a and x=b such that a<b. Part iii investigates the ratio of the volumes formed around the y-axis when y = xn is graphed between two arbitrary parameters x = a and x=b such that a<b. To investigate these ratios the program Autograph 3.20 was used in order to obtain sets of results. All areas were found using Simpson's rule at 50 divisions. Part i: Introduction: In this investigation the ratio of the areas formed when y = xn is graphed between two arbitrary parameters x = a and x=b such that a<b will be investigated. This investigation will investigate the ratio area A: area B. Area A is the area contained in between the graph and the y-axis between the arbitrary parameters x = a and x = b. Area B is the area contained in between the graph and the x-axis between the arbitrary parameters x = a and x = b. However, in investigating this there is a small problem. Using modern technology the area between the graph and the x-axis can easily be found. However, not all programs allow for the area

Derivative of Sine Functions
Derivative of Sine Functions Question 1 Investigate the derivative of the function f(x) =sinx. a) Graph the function f(x) =sinx. For-2x2 y=f(x). Let f(x)=sinx ,-2x2 By sketching the graph we get: Figure 1 : graph of function f(x) =sinx Figure 1 reveals the range of the function f(x) =sinx. is [-1,1]. b) Based on this graph, describe as carefully and fully as you can, the behabiour of the gradient of the function on the given domain. The gradient of each point on the curve is valued as the gradient of the tangent line of the point. According to the curve in figure 1, the behaviour of the gradient of the function indicates the following characteristics: ·The line of the tangent become flatter and flatter as the points move from left to right within -2 to -,- to -,0to , to . The line of the tangent become more and more precipitous as the points move from left to right within - to -,- to 0, to , to 2. ·In the domain of : [-2,-[, ]-,[,],2]the gradient is positive. The gradient is negative in the domain of::]-,-[, ], [. ·At the point when x equals to -,-,and ,the gradient is obviously 0. c) Use your Graphics Calculator (GC) to find numerical values of the gradient of the function at every /4 unit. Sketch your findings on a graph. . The numerical values (in 3 significant figures) of the gradient of the function at every /4 unit is shown in the table below: X

Investigating Parabolas
Description In this task, you will investigate the patterns in the intersections of parabolas and the lines y = x and y = 2x. Then you will be asked to prove your conjectures and to broaden the scope of the investigation to include other lines and other types of polynomials. Background Functions: 1)=ax + b, a = 0 - Linear Equation 2) ax2+ bx+c - Quadratic 3) ax3+ bx2+cx+d - Cubic 4) ax4+ bx3+cx2+dx+e - Quartic Introduction The investigation of parabola brings me to think and promote my knowledge about quadratic functions. Also, it helps me to find the 'patterns' and 'rules' of parabola which was another great source to improve my mathematic skills. In the HL type I, it asks about thoughtful questions such as relationship between parabolas and lines. There are six questions in this portfolio and each question requires rumination. I will try to focus on the member of the family of polynomials precisely since they are the basic functions of these problems and it will help me to 'link' some ideas. Equally important, interestingly, this portfolio wants the student to find their 'own' conjecture. Thus, I will try to focus on the patterns the questions have in order to find accuracy conjectures. Part One ) Consider the parabola y = (x-3)2 + 2 = x2 -6x + 11 and

Gold Medal heights IB IA- score 15
International Baccalaureate Gold Medal Heights SL Math IA- Type II Turner Fenton Secondary School Completed by: Harsh Patel Student Number: 643984 IB number: Teacher: Mr. Persaud Course Code: MHF4U7-C Due Date: November 16th, 2012 Introduction This report will investigate the winning heights of high jump gold medalists in the Olympics. The Olympics composed of several events evaluating physical strength of humans. Every Olympic game brings different numerical value for a height that a person can jump, allowing for different data collection. First of all, the data ranging from the years 1932 to 1980 will be portrayed on a graph for observation. From thorough investigation, the best curvature or line that fits the trend of the data will be selected to represent the relation. The function will be algebraically approached using the numerical values of the data points. Through the use of technology, the parameters will be plugged in to illustrate that function electronically. The function will be observed and any limitations with the model will be indicated. The function might need refinement according to any outliers/ anomalies, also to better represent the trend. The model function and a given function by the programme will be compared. Since the Olympics were not held during the years 1940 and 1944 due to WWII, this function will help determine the possible outcomes
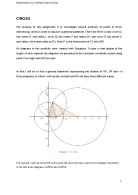
Circles Portfolio. The purpose of this assignment is to investigate several positions of points in three intersecting circles in order to discover a general statement
Mathematics SL, Portfolio Type 1Circles CIRCLES The purpose of this assignment is to investigate several positions of points in three intersecting circles in order to discover a general statement. There are three circles: circle C1 has center O and radius r, circle C2 has center P and radius OP, and circle C3 has center A and radius r (the same radio as C3). Point P' is the intersection of C3 with (OP). All diagrams in this portfolio were created with Geogebra. To give a clear display of the length of each segment the diagrams are presented in the Cartesian coordinate system using point O as origin and (OP) as x-axis. At first I will try to find a general statement representing the relation of OP’, OP and r in three examples, in which r will remain constant and OP will have three different values. Diagram 1: r=1, OP=2 The method I will use to find OP’ will include the cosine function used in two triangles I will sketch in the first three diagrams: and. In diagram 1: Triangle OPA Triangle OP’A a₁=OP=2 a₂=OP’=? o= PA=2