
The Koch Snowflake
The Koch Snowflake IB Portfolio 1/21/2007 IB HL Math Year 1 Felipe F Fagundes The purpose of doing this investigation is so that we can learn about the different patterns that the Koch Snowflake presents. The simple fact of the Koch Snowflake is a fractal already says a lot about it. A fractal is a figure which repeats itself in smaller scales. For example if stage 12 was looked closer stage two would be found and so would be stage 3 and so on. In this investigation we explored the patterns that emerge from one stage to the other. We tried to find any patterns for when n= 0,1,2,3 that could be applied to find any other n term. We specifically looked for patterns in N= the number of sides, L= the length of one side, P= the total perimeter, and A= the total area. And in order to come up with these patterns we used many resources like drawing in order to prove that our results were accurate. - Using an initial side length of 1, create a table that shows the value of Nn , ln ,Pn , and An for n= 0, 1, 2, 3. Don't make decimal approximation; use exact values. n 0 2 3 N 3 2 48 92 L ,1-3. ,1-9. ,1-27. P 3 4 ,16-3. ,64-9. A ,,-3.-4. ,,-3.-3. ,10,-3.-27. ,94,-3.-243. N= I was able to come up with the number of sides (N) by counting the number of sides of the triangles in the drawing of the fractals. When I had to count the number of sides in stage 3 I

Stellar Numbers. In this folio task, we are going to determine difference geometric shapes, which lead to special numbers.
Stellar numbers Folio Michael Wong ________________ Introduction In this folio task, we are going to determine difference geometric shapes, which lead to special numbers. The task will be achieved by using the theories of sequences and series. Due to the difference pattern of stellar numbers diagrams, the first thing to do is drawing diagrams and hence to work out the change of the dots and explain the pattern for each of them. After that, we are able to find out the general term of them and test them by substituting a number. Also, TI-84 Plus calculator will help to prove the statement is correct or not. The task will be similarly achieved by the example below, By seeing the pattern, from 0, there is no square without any dots. When the general number changed to 1, there is 1 dot. In the following, the general term number changed to 2, there are 4 dots and hence to create a square. Furthermore, when the general number changed to 3, there are 9 dots which will create a bigger size of square. Hence, we are able to create a table to demonstrating the change rule of the square stellar diagram below, Side no. Square no. 1 1 2 4 3 9 4 16 Assume, Un = Sq. no. (Square number) n = side no. (gerneral term number) Therefore, the general statement of it is Un = n2,
Maths HL Type 1 Portfolio Parabolas
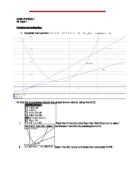
Maths Portfolio 1 HL Type 1 Parabola Investigation . Consider the function To find the four intersections in the graph shown above using the GDC, i. Press the 2nd button and then the TRACE button to select the CALC function. Select the intersect function by pressing button 5. ii. Select the first curve of intersection and press ENTER. iii. Select the second curve of intersection and press ENTER. iv. Select the area of estimation of the intersection point and press ENTER. v. The first intersection point between Repeat the above steps i-iv, to obtain the other intersection points between . The second intersection point between The first intersection point of The second intersection point of The To find the values of , To calculate the value of , 2. To find other values of D for other parabolas of the form ,with vertices in quadrant 1, intersected by the lines Consider the parabola and the lines , The intersections of the parabola with the lines can be calculated using both the GDC and manual calculation. By manual calculation, To calculate the intersection between , Sub (2) into (1), Sub Sub The intersections between the parabola are (3,3) and (6,6). By using the GDC, To calculate the intersection between i. Key in equations of into the GDC, ii. Press the TRACE button to plot the graph on the GDC, iii. Press the 2nd button and the

Ib math HL portfolio parabola investigation
Math HL Portfolio Parabola Investigation INTRODUCTION In this portfolio I am going to investigate the patterns formed when a parabola, y=ax2+bx+c intersects with the lines y=x and y=2x. Further I would be broadening the scope of this investigation to other lines and other orders of polynomials and observing patterns in their respective intersections. The first part of my portfolio would include parabolas with their turning points located in the 1st quadrant of a graph. I would be investigating the patterns formed when the two lines y=x and y=2x intersect with parabolas that have different coefficients of x2 but lie in the first quadrant and form a conjecture. Then I would prove it and test its limitations. The second part would include testing and modifying my conjecture for the turning point of the parabola situated in any quadrant and testing for all real co-efficient of x2. The third part would include modifications to the conjecture if the intersecting lines are changed and hence finding its limitations. In the final part of my portfolio I will also try and make a conjecture for polynomials of higher order and derive any patterns or observations plausible. PARABOLAS IN THE FIRST QUADRANT INTERSECTING WITH y=x AND y=2x. A polynomial is a mathematical expression involving a sum of powers in one or more variables multiplied by coefficients. A polynomial in one

Stellar numbers. This internal assessment has been written to embrace one of the rather inquisitive aspects of mathematics, stellar numbers
Last Name Sample IB Math SL Mr. Doty 1 September 2011 Internal Assessment 1: Type 1 Stellar Numbers This internal assessment has been written to embrace one of the rather inquisitive aspects of mathematics, stellar numbers.A stellar number is a numerical value for the total number of dots that can be positioned within a designated geometric shape with a determined number of vertices.This paper will consist of a panoptic yet concise set of instructions involving the use of technology, primarily a graphic calculator and a computer, for the reader to fully appreciate how this candidate analyzed the patterns of various examples of triangular and stellar numbers to formulate a conclusive general statement regarding the variables p, the number of vertices, and n, the term of the stellar number. In mathematics, it is essential that the learner is able to distinguish a pattern within a set of numbers, define the pattern using words, and carry on the pattern. A series of numbers in which a pattern is present is called a number sequence. The numbers in the sequence are called its members or its terms. A number sequence can be defined with the use a formula which represents the general term or also known as the nth term.The formula is useful for determining the value of the nth term without actually having to count out and write down every single member of the sequence.

MATH IA- Filling up the petrol tank ARWA and BAO
[Math Hl Portfolio type 2 Samkit shah] Filling up the Petrol Tank In this world money is one of the most important things, and hence we try to save as much money as possible. Even drivers try to save as much money as possible. Some places sell fuel for lower prices than others. Is it more economical to travel a larger distance to get cheaper fuel or is it more economic to travel a shorter distance but to buy relatively expensive fuel? Let’s investigate! There are two people Arwa and Bao, who share the same driving route r of 20km. Let’s assume: . The two are neighbors and work at the same place. 2. They drive to work every day. 3. They buy fuel in the morning, before going to work, every second Monday, as they are busy people. 4. They used their car only to go to work and they work only from Monday to Friday. 5. They are cautious people and so they always have at least 5litres petrol as reserve. If it goes below that they will go and refuel at that instant. 6. They have enough petrol to reach the gas station initially. After reaching the gas station they buy exactly the fuel required to drive to work the next ten days and to drive to and from the station (if the gas station is not on the route). Since Arwa and Bao work only Monday to Friday and use their car only to go to work, we can say that they fuel up every 10 working days (number of working days after
Crows dropping nuts
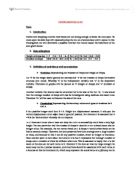
CROWS DROPPING NUTS Task: . Introduction: Crows love dropping nuts but their beaks are not strong enough to break the nuts open. To crack open the shell they will repeatedly drop the nut on a hard surface until it opens. In this investigation we will determine a possible function that would model the behaviour of the data given below. 2. Data table given: Height of drops (m) .7 2.0 2.9 4.1 5.6 6.3 7.0 8.0 0.0 3.9 Number of drops 42.0 21.0 0.3 6.8 5.1 4.8 4.4 4.1 3.7 3.2 3. Definition of variables as well as constraints: > Variables: Representing the Number of Drops and Height of Drops, Let 'h' be the height above ground (in metres) and 'n' be the number of drops favourable outcome (nut crack). Whereby 'h' is the independent variable and 'n' is the dependent variable. Therefore all graphs will be plotted as 'h' (height of drops) and 'n' (number of drops). Another variable that should also be accounted for is the size of the nut 'Sn'. It was stated that the average number of drops will also be investigated using medium and small nuts. Therefore 'Sn' will be used to illustrate the size of the nuts. > Constraints: Representing the boundary values and types of numbers for h and n, h is a positive integer such that: 0 < h. Height is a displacement measure, it tells you the vertical displacement of an object from a 'ground' position. For this data it

Maths IA Type 2 Modelling a Functional Building. The independent variable in this investigation is the height of the building. The maximum volume of a cuboid under the roof depends on the height of the roof, which is the dependant variable.
QUEENSLAND ACADEMY FOR SCIENCE, MATHS AND TECHNOLOGY Maths IA Type 2 Modelling a Functional Building Francis Nguyen Mr Mathews Introduction: The structure of a roof for a building is parabolic. The design of this building has a fixed rectangular base which is 150m long and 72m wide. The maximum height of this building can vary between 50% - 75% of its width for stability and aesthetic purposes. The independent variable in this investigation is the height of the building. The maximum volume of a cuboid under the roof depends on the height of the roof, which is the dependant variable. All calculations will be made through Ti-nSpire calculator (GDC; Graphical Display Calculator) and all figures will be rounded to 3 decimal places as architects work with millimetres where as this report works in meters. The Function: The model of the roof structure will be designed on a Cartesian plane using the graphing package, Graph. The axis of symmetry (also the maximum turning point in this case) will be modelled at within this report (refer to Fig 1 below). The roots of the quadratic will be at a fixed co-ordinate of (-36,0) and (36,0) as the distance between these 2 points is 72m long for when the façade is designed at the width (refer to Fig 2). From these requirements, we manipulate the general form of the quadratic function to fit the purposes of this report.
The segment of a polygon
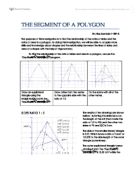
THE SEGMENT OF A POLYGON BY: RISA SANTOSO 11DP-2 The purpose of this investigation is to find the relationship of the ratios of sides and the ratios of area in a polygon. By doing this investigation, we will be able to acquire more skills and knowledge about shapes and the relationship between the lines of sides and area of a shape with the help of trigonometry. To find the relationship of the ratio of sides and area in a polygon, we use the "Geometer's Sketchpad" program. Draw an equilateral triangle using the straightedge tool in the "Geometer's Sketchpad". Draw a line from the vertex to the opposite side with the ratio of 1:2 Do the same with all of the other vertex. SIDES RATIO 1 : 2 The results of the drawings are shown bellow. By letting the sides be 6 cm, the length of the AR (that made the ratio of 1:2 to RB) and the other two sides of PB and QC is 2 cm. The side of the smaller (inner) triangle is 2.27. Which have a ratio of 2.64:1 or 1:0.378 to the side length of the outer triangle (outer:inner) . The outer equilateral triangle's area obtained from the "Geometer's Sketchpad" is 15.59 cm² while the inner equilateral triangle's area is 2.227cm². The sketchpad ratio of the two area are 1:0.143 or 7:1 (outer : inner). SIDES RATIO 1 : 3 This is the results of the drawings of the ratio 1:3 (length of sides). Like the graph on 1:2, let the sides be 6 cm,
Math IA- Type 1 The Segments of a Polygon
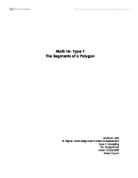
Math IA- Type 1 The Segments of a Polygon Abhinav Jain IB Higher Level Assignment: Internal Assessment Type 1: Modeling Mr. Murgatroyd Date: 15/03/2009 Word Count: . In an equilateral triangle ABC, a line segment is drawn from each vertex to a point on the opposite side so that the segment divides the side in the ratio 1:2, creating another equilateral triangle DEF. a) i) ii) Measurements and drawing shown above has been made through the Geometer's Sketchpad package. Measure of one side of the ?ABC = 12cm Measure of one side of the ?DEF = 5cm iii) The areas have also been calculated using the Geometer's Sketchpad package and are show in the diagram above. For ?ABC = 62.5cm2 For ?DEF = 8.8 cm2 In order to find the ratio, one needs to divide the area of ?ABC by the area of the ?DEF which will give one the ratio of the area of the bigger triangle to the smaller triangle. Therefore 62.5cm2 ÷ 8.8 cm2 = 7:1 The ratio between the areas of the equilateral ?ABC to ?DEF when the segment divides the side in the ratio 1:2 is 7:1. b) In order to repeat the procedure above for at least two other side ratios, 1: n The two ratios chosen are 1:3 and 1:4 for no specific reason. Ratio of Sides = 1:3 Again, the diagram above and values were obtained and created using Geometer's Sketchpad Package. For ?ABC = 62.0 cm2 For ?DEF = 19.1 cm2 In order to find the