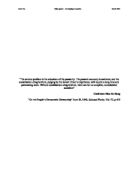
Table 1: Gini Coefficients of Rural Households in China, 1979-1988
Chai also collected Gini coefficients for the above data, and although his results are not exactly identical to those of Rozelle, the trend that shown is alike. As Gini coefficients deal with income inequality, the data shows that there is a definite rise in income disparity as a result of the reform of agriculture in the countryside. The removal of the strict communal allocation of resources to each peasant individually gave way to markets and profit incentives, encouraging private enterprise. As a direct result of this, some successful peasants were able to translate increased productivity and hard work into increased profits and income. Something that was almost impossible under the Maoist system. This is clearly illustrated in the rise the Gini coefficient from 0.195 in 1979 to 0.268 in 1988.
It should be noted, however, that a Gini coefficient of 0.268 is by no means a figure that implies high levels of income inequality. By international standards, a figure of 0.268 still indicates that income disparity is fairly low. Hence all we can conclude from the above data is that income inequality in rural areas rose during the reform period, but did on the whole, remain low.
Another way of examining inequality is by looking at the Gross Value of Industrial and Agricultural Output (GVIAO), in an economy. This calculation takes into the account the output of cropped agriculture, livestock, other agriculture (including forestry and fishery) and rural industry. It is a measure of net income.
Rozelle concludes that the trend of GVIAO inequality is as that of income inequality. Over the period of 1983 to 1989 there is a slow but steady rise in the level of GVIAO inequality in the Jiangsu province as a whole. However at township and village level the rise in level of GVIAO inequality is almost negligible. Tsui calculated a value of GVIAO inequality in every province (excluding Tibet) in China for 1988, and averaging these values we get a value of 0.268, which is, coincidentally identical to the Gini coefficient given for 1988 in Table 1. Tsui does, however, calculate that GVIAO inequality in urban areas accounts for 8% of overall inequality, and as the data for GVIAO given is not specifically split into urban and rural areas, it can be used as a guideline, but not as an explicit view, of inequality trends in rural areas, as well as, in smaller part, in urban areas.
In any case, the trend was, in both income and GVIAO inequality in rural areas, identical. There is a rise in inequality during the reform period. This rise is, however, slow and by 1988 levels of inequality in rural areas were still relatively low.
The urban economy:
Urban income has grown rapidly since urban reforms started in 1984. Between 1984 and 1993 the average household member's real income increased by 81 percent, with an average annual growth rate of 7.5 percent. Figures for urban inequality are incomplete.
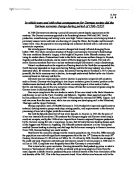
Table 2: Gini Coefficients of Urban Households in China, 1977 - 1990
However, even from examining even this fragmented data, it is clear, disregarding the possibility of massive fluctuations of the Gini coefficient in the years between 1978-1983, that income inequality in rural areas did not change very significantly during the reform period, and is at an almost an identical level in 1977 before the reform period, as in 1990 after several years of reform.
During the reform period, most employees in urban areas were employed by the state. As a result of this, wages were controlled by the state, and therefore fairly equal among all employees. Lardy argues that huge government subsidies to state employed workers, especially with regards to food, helped keep inequality in urban areas low.
Having analysed both urban and rural inequality separately, it is fair to conclude that both intra rural and intra urban inequality remained low during the reform period.
Rozelle also makes the point that at township and village level, inequality within the villages and townships, over this time period stayed relatively low and was fairly constant. Between 1983 and 1989 village inequality in townships rose only 15%, inequality between townships in counties rose by 40%, whereas inter-county inequality rose by almost 100%. Arising from this is the idea that although disparity may have been low in individual areas, i.e. an individual village, city or even county, regional disparities existed. Rozelle blames the existence of protectionist “barriers” imposed by local governments. These include taxes, road blocks, licensing, quotas and other administrative measures. Tax revenues had a cap, and so there was an extent as to which larger departmental units could utilise tax revenues to smooth over income disparity. The redistribution policies that existed under Mao faded away under the reforms. The local markets that were established simply did not integrate the economy. The subsidies that governments provided in urban areas also contributed to this increasing urban-rural inequality. Governments heavily subsidised the price of foodstuffs for its workers in cities, and as a result peasants in rural areas were paying up to double the price that urban residents were for staple foods such as grain and wheat. This, coupled with much higher wages in urban areas, led to urban-rural disparity gaps further widening.
In 1988 average urban per capita GVIAO was 4.39 times higher than in rural areas. The extreme of this is in Beijing, where urban GVIAO was 9.19 times higher than in rural areas. Urban-rural inequality accounted for 52% of overall GVIAO inequality. In Tianjing rural-urban inequality accounted for 96% of inequality.
There is research that indicates that levels of consumption were converging between urban and rural areas, at least in the early reform years. Both Lardy and Chai note rapidly expanding national levels of consumption although they disagree as to actual rate of growth of consumption. Lardy estimates a 62% rise in level of per capita consumption between 1978 and 1983, whereas Chai estimates a figure of 44% for the same period. In any case, there is a definite consensus that as the output and disposable incomes of peasants rapidly rose, as did consumption.
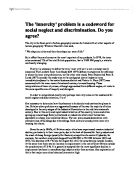
Table 3: Urban and Rural Real Personal Consumption per Capita (Yuan in 1980 prices)
The trend shown by comparing urban and rural consumption is that between the years of 1978 and 1985 the gap between urban and rural consumption levels is narrowing. As previously stated, first-stage reform policies were aimed at improving agricultural output. Increased investment into the agricultural sector gave rural peasants a rising, in comparative terms, level of disposable income and therefore increased the consumption power of the rural sector as a whole. This is exactly why the gap between urban and rural consumption narrowed in this period. However, from the mid-1980’s onwards there was a shift in policy towards increasing industrial output. The effect of this was to increase disposable incomes of the urban population and hence once cause a re-widening of the gap between urban and rural consumption levels. There is evidence that rural households were also squeezing their food and general consumption in order to free up capital to invest in better housing and consumer durables. This, coupled with rising wages and the subsidies enjoyed in urban areas, meant that from 1985 onwards, urban-rural consumption disparity began to steadily increase.
This is proof that policies aimed at promoting agriculture were successful in narrowing urban-rural inequality gaps, mainly due to the low and negative elasticity of cropped agriculture, the predominant component of GVIAO in rural areas. A negative elasticity of output of cropped agriculture means that an increase in output in cropped agriculture lowers income disparity. On the other hand, rising investment in the urban and industrial sectors caused disparity to rise, on account of the large and positive elasticity of industrial output. A rise in output from industry causes a rise in inequality.
Graph 1 illustrates the point that there was a definite narrowing of the gap between rural disposable income and consumption, with that in urban areas towards the mid 1980’s. From then onwards there was a noticeable widening of the gap, highlighting increasing income and consumption urban-rural disparity. An interesting point to note is that over the time period urban consumption is higher than urban disposable income. This may be a simple discrepancy in the figures, or, as Lardy suggests, the consumption figures may simply have been understated owing to the subsidies urban residents enjoyed. This is likely, as the “deflator used to derive real consumption is derived from the Chinese linked index of “Comparable prices.””
Another by-product of the 1978-1985 reforms of agriculture, and the increase in output and income associated with them, was a sharp fall in the level of poverty experienced in the rural sector. World Bank estimates that, absolute poverty declined dramatically from 262 million (around one-third of rural households) in 1978 to 88 million people (around one-tenth) in 1984. From 1985 to 1993 there was little change in the number of peasants at absolute poverty level. Between 1978 and 1993 there were few years in which the shares of urban households living below the absolute poverty line exceeded 1 percent. Between 1990 and 1993 the rate of absolute poverty in urban areas fell below 0.1 percent.
Levels of relative poverty, defined as those households living at below 50% the mean national or regional income level, show a similar trend.
Table 4: Rural and Urban Poverty Indices
The data shows that there was a dramatic fall in levels of poverty in rural areas during the agricultural reform period until 1985. After this point, when policy focused predominantly on increasing industrial output, there was a small rise in the level of poverty in rural areas. In urban areas during the rural agricultural reform of 1978 to 1985, there was a small fall in levels of poverty, but this accelerated between 1985 and 1990 during the industrial reform period. The percentage of households classified as below the poverty line in urban areas fell from 9.9% to 3.4% during this 5-year period.
In 1988, cases of infant mortality in rural areas were 62% higher than in urban areas. Cases of illiteracy or semi-illiteracy were 98% higher in rural area than in urban areas. This indicates that levels of healthcare and education were far higher in urban areas than in rural areas.
Chen and Fleisher state that inequality within specific regions is lessening, whilst interregional inequality when comparing the eastern, coastal, region and the non-coastal region is increasing. For purpose of my analysis I will consider China in three regions as described below:
Table 5: Coastal, Interior and Western Provinces of China
The spread of these provinces over the map of China is shown below:
Map 1: China split into Coastal, Interior and Western regions
Orange: Coastal Region; Green: Interior Region; Black: Western Region
From Map 1 one can see that the land area occupied by the coastal provinces is far less than the interior provinces, which is again far less than the area occupied by the western provinces, even though only 9 provinces make up the western region, whereas the coastal and interior regions both contain 10 each.
Table 6: Average per capita net income in Coastal, Interior and Western regions (Yuan)
Although there is no formal data, of which I am aware, that calculates interregional (between the coastal, interior and western regions) Gini coefficients that could be used for my investigation, table 6 implies that there is, between 1985 and 1990, an increase in disparity, at least on a raw income level, between coastal, interior and western regions. Net income is growing at a faster rate in the coastal provinces than in both interior and western regions. This is consistent with the observations of Chen and Fleisher who conclude that although there may be a slight convergence towards equality within regions, there is a definite divergence of disparity between “coastal” and “non-coastal” regions. Wei and Wu also state the lack of agreeable data for interregional inequality, and conclude, “Depending on the specification one uses, one obtains either a modest reduction in overall [interregional] inequality or a modest increase”.
The geography of China favours the eastern coastal region. It is more accessible to foreign investors, and has traditionally attracted higher levels of foreign investment than the interior and western regions. Through historical foreign influence in coastal regions, these provinces have gained the business “know-how” that is lacking in the non-coastal regions. Interregional barriers have made it difficult to export this “know-how” to other regions.
In order to counteract this growing interregional inequality, the government has tried to raise levels of investment in the interior and western regions. Between 1978 and 1993 “non-coastal provinces had a total investment/GDP ratio 10% higher than the coastal provinces”.
According to Tsui, however, this direction of government policy may actually encourage disparity to rise. Tsui argues that if the government increases investment in industrial projects in order to lower interregional inequality, rural-urban inequality will rise. From the mid-1980’s onwards there was a drive to try and invest in, and grow the industrial sector. Rozelle measures the elasticities of inequality. This shows the percentage change in Gini ratio for a 1% increase in the output of a specific sector. He concludes that rural industry has an elasticity that is high and positive. He estimates that a 10% increase in output of rural industry would lead to a 4% increase inequality. The rise in urban-rural inequality may, therefore, counteract the effect of trying to decrease interregional disparity by investing in industry. This line of policy could cause overall inequality to rise.
Examining levels of poverty and comparing the coastal, interior and western regions further enforces the fact that vast levels of interregional inequality do exist.
Table 7: Regional Rural Povery Index in 1989
From Table 7 it can be seen that incidences of poverty are remarkably higher in the western and interior regions than in coastal regions. Despite housing only 31.5% of the nations counties, the western region contains a staggering 49.8% of China’s poor counties. In the coastal region can be found a mere 8.1% of China’s poor counties, despite it containing 26.1% of China’s total counties.
Table 8: Infant Mortality and Illiteracy Rates for Coastal, Interior and Western Regions in 1988
In 1988 illiteracy and infant mortality rates were much higher in western and interior provinces than in the coastal region. Most noticeably incidents of infant mortality were at around 6% in the western region in comparison to the 2% in the coastal region. This implies that healthcare and education provisions and standards were higher in the coastal provinces than in interior provinces and much higher than in western provinces.
In conclusion I have found that as a result of the reforms since 1978, consumption, income and output levels have all risen. In that sense the government reform policies have been successful in stimulating and sustaining high levels of growth, which was their primary objective. There is evidence that consumer satisfaction with goods has increased, as through the market system firms must stay competitive and bend to the demands of the consumer, and so product quality has risen. However, from my research I can conclude that the major cost of this dramatic increase in output has been rising levels of inequality, notably urban-rural inequality and interregional inequality. In many senses the two inequalities are heavily linked. The coastal areas, through ease of access for foreign investors, a history of trade with foreign firms and a large catalogue of business know how, have blossomed and formed the industrial powerhouse and economic centre of the country. As we move through China from east to west, the level of foreign investment saturation and urban development and industrialisation lessens, and so we find that western provinces are predominantly agricultural provinces. Because of this it is possible to see the interregional inequality as a simple extension of urban-rural inequality on a nationwide scale. The data certainly supports this hypothesis as the inequalities that exist between the coastal and in particular the western region of China, almost exactly mirror urban-rural inequality patterns. Interregional healthcare and education disparity is extremely similar to the data for urban-rural inequality of the same variables. In the early reform period from 1978 to 1985, the government heavily focused on developing agriculture and rural areas. In this period there was a closing of the inequality gap between rural and urban areas, in both income and consumption. However in the mid 1980’s the government switched its efforts towards developing the industrial sector, leading to a re-widening of the gap between urban and rural areas. From this I conclude that those policies aimed at promoting agriculture helped to bridge the inequality gap, whereas those policies aimed at promoting industry, simply encouraged disparity. Although extremely successful in increasing output of the economy, the reform period policies have not been entirely successful in integrating the agricultural economy into the new industrial economy, and bridging over disparities that are apparent between the two sectors.
Further work
A limiting factor in my research has been the non-availability of concrete data. This stems from a vast variety of reasons, some of which I have highlighted. I would like to continue my research into the extent to which inequality between coastal, interior and western China is simply an extension of urban-rural inequality, and to therefore establish whether this inequality could be eradicated through careful investment in the industrial sectors of the interior and western provinces, whilst moving away from agriculture. It would be interesting to study the effect on the entire economy of moving away from agriculture. The sheer scale of the Chinese economy excites me, and I would like to research the surviving self-sufficient peasant groups that must surely be considered as fairly anomalous in this investigation due to their very nature of self-sufficiency and their natural exemption from the Chinese economic model. Another area of interest is to the extent to which the interregional barriers, mentioned by Rozelle are still in place today, and the extent to which saturation of the interior and western regions is possible through foreign investment as a result of this.
Bibliography
BRAMALL C. & JONES M. 'Rural income inequality in China since 1978'
Journal of Peasant Studies 21 (1993)
KHAN R., GRIFFIN K, RISKIN C. & ZHAO Renwei 'Household income and its
distribution in China' China Quarterly (1992)
ROZELLE S. 'Rural industrialisation and increasing inequality: emerging
patterns in China's reforming economy' Journal of Comparative Economics
19 (1994)
WEI Shang-Jin & WU Yi. ‘Globalisation and Inequality: Evidence from Within China’ NBER Working Paper 8611,Cambridge, Massachusetts: National Bureau of Economic Research, 2001
LARDY N. ‘Consumption and Living Standards in China, 1978-83’ China Quarterly (1984)
CHAI J. ‘Consumption and Living Standards in China’ China Quarterly (1992)
TSUI Kai-Yuen. ‘Decomposition of China’s Regional Inequalities’ Journal of Comparative Economics 17 (1993)
CHEN Jian & FLEISHER B. ‘Regional Income Inequality and Economic Growth in China’ Journal of Comparative Economics 22 (1996)
YING Y. ‘Income, Poverty and Inequality in China During Transition to a Market Economy’ WPS no. 10, 1996
PUDNEY P. ‘Income, Wealth and the Life-Cycle: A Non-Parametric Analysis for China’ CP No.16 1991
Rozelle S. ‘Rural Industrialisation and Increasing Inequality: Emerging Patterns in China’s Reforming Economy’
Rozelle S. ‘Rural Industrialisation and Increasing Inequality: Emerging Patterns in China’s Reforming Economy’
YING Y. ‘Income, Poverty and Inequality in China During Transition to a Market Economy’
Data source: Rozelle S. ‘Rural Industrialisation and Increasing Inequality: Emerging Patterns in China’s Reforming Economy’. Data is given by averaging data from 13 provinces outlined by Rozelle. Data for 1979 and 1980 are incomplete, and so averages of the data available is here used.
Rozelle S. ‘Rural Industrialisation and Increasing Inequality: Emerging Patterns in China’s Reforming Economy’
TSUI Kai-Yuen. ‘Decomposition of China’s Regional Inequalities’
YING Y. ‘Income, Poverty and Inequality in China During Transition to a Market Economy’
Data source: CHAI J. ‘Consumption and Living Standards in China’
LARDY N. ‘Consumption and Living Standards in China, 1978-83’
Rozelle S. ‘Rural Industrialisation and Increasing Inequality: Emerging Patterns in China’s Reforming Economy’
LARDY N. ‘Consumption and Living Standards in China, 1978-83’
TSUI Kai-Yuen. ‘Decomposition of China’s Regional Inequalities’
TSUI Kai-Yuen. ‘Decomposition of China’s Regional Inequalities’
Data source: CHAI J. ‘Consumption and Living Standards in China’
CHAI J. ‘Consumption and Living Standards in China’
Rozelle S. ‘Rural Industrialisation and Increasing Inequality: Emerging Patterns in China’s Reforming Economy’
Data from: CHAI J. ‘Consumption and Living Standards in China’
CHAI J. ‘Consumption and Living Standards in China’ p722
YING Y. ‘Income, Poverty and Inequality in China During Transition to a Market Economy’
Data source: CHAI J. ‘Consumption and Living Standards in China’
TSUI Kai-Yuen. ‘Decomposition of China’s Regional Inequalities’
CHEN Jian & FLEISHER B. ‘Regional Income Inequality and Economic Growth in China’
Source: website; http://www.fas.usda.gov/pecad/remote/china/chmap.html
Data source: CHAI J. ‘Consumption and Living Standards in China’. Data in this table is given as an average of the data compiled by Chai.
Results from Chai, Lardy and Tsui contradict a sustained convergence in disparity within regions during the period under study.
WEI Shang-Jin & WU Yi. ‘Globalisation and Inequality: Evidence from Within China’
CHEN Jian & FLEISHER B. ‘Regional Income Inequality and Economic Growth in China’
TSUI Kai-Yuen. ‘Decomposition of China’s Regional Inequalities’
Data source: CHAI J. ‘Consumption and Living Standards in China’. Poor counties are defined as those with an average income of less than 300 Yuan per capita.
Data source: TSUI Kai-Yuen. ‘Decomposition of China’s Regional Inequalities’