3. Socio-cultural – changing attitudes and behaviour
4. Natural – global warming?
5. Technological – advances in IT, use of the internet, for example
6. Political-legal – consumers calling for more laws perhaps, or more willing to sue companies
The Demographic Environment
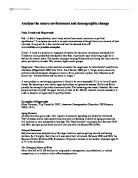
Worldwide population growth
6.1 billion people in 2000. Could be 7.9 billion in 2025.
A breakdown carried out back in 1993 showed that if the world were a village of 1,000 people, it would consist of:
- 520 women and 480 men, 330 children, and 60 people over age 65,
- 10 college graduates and 335 illiterate adults.
- The village would contain 584 Asians, 150 Europeans inc. former USSR, 124 Africans, 84 Latin Americans, 52 North Americans.
- Communication would be difficult. 165 would speak Mandarin, 86 English, 83 Hindi/Urdu, 64 Spanish, 58 Russian, 37 Arabic. The rest would speak over 200 other languages.
- There would be 329 Christians, 178 Muslims, 132 Hindus, 62 Buddhists, 3 Jews, 167 non-religious, and 86 others.
While economically very important, Christian Europeans/North Americans are only a minority of the world’s population.
Birth rates are lowest in former communist countries.
Fastest growing populations 2000-05 (Economist Pocket World in Figures, 2006):
1 UAE 6.5 % per year
2 Qatar 5.9 %
3 Afghanistan 4.6 %
Slowest growing populations 2000-05 (Economist Pocket World in Figures, 2006):
1 Ukraine -1.1 %
2 Georgia -1.1 %
3 Bulgaria -0.7 %
World 1.2 %
Canada 1.0 %
France 0.4 %
Germany 0.1 %
Italy 0.1 %
Japan 0.2 %
Russia -0.5 %
United Kingdom 0.3 %
United States 1.0 %
China 0.7 %
India 1.6 %
Highest fertility rates 2000-05 – children per woman (Economist Pocket World in Figures, 2006):
1 Niger 7.9
2 Afghanistan 7.5
3 Guinea-Bissau 7.1
3 Uganda 7.1
Lowest fertility rates 2000-05 – children per woman (Economist Pocket World in Figures, 2006):
1 Macau 0.8
2 Hong Kong 0.9
3 Ukraine 1.1
World 2.7
Canada 1.5
France 1.9
Germany 1.3
Italy 1.3
Japan 1.3
Russia 1.3
United Kingdom 1.7
United States 2.0
China 1.7
India 3.1
Example of the effect of low fertility rate:
China’s one child policy has resulted in children being spoilt and fussed over as never before. This has encouraged toy companies such as Japan’s Bandai, Denmark’s Lego Group, and the US’s Hasbro and Mattel to promote themselves heavily in the Chinese market.
Highest median age 2005 (Economist Pocket World in Figures, 2006):
1 Japan 43
2 Italy 42
3 Germany 42
Lowest median age 2005 (Economist Pocket World in Figures, 2006):
1 Uganda 15
2 Niger 16
3 Mali 16
There is a global trend towards an aging population. The Japanese, who have the world’s highest average age, are describing it as the ‘Silver Century’. (Kotler and Keller, 2006: 80) Such people have more need for healthcare, providing opportunities, for example, for pharmaceutical companies.
In the US, baby boomers are getting older, while the next generation is smaller. Those born between 1965 and 1976 are known as Generation X. This is affecting advertising. While the baby boomers grew up with television advertising and are easier to reach, Generation X is more cynical about hard-sell marketing pitches that promise more than they can deliver. (Kotler and Keller, 2006: 81)
Generation Y, or the echo boomers, is the next generation born between 1977 and 1994. They ‘echo’ because their number is similar to that of the baby boomers. This generation is completely comfortable with the computer and the internet. (Kotler and Keller, 2006: 81) Don Tapscott has described them as “Net-Gens” because “To them, difital technology is no more intimidating than a VCR or a toaster.” (Growing Up Digital; The Rise of the Net Generation, New York: McGraw-Hill, 1997)
Most male population 2005, males per 100 females (Economist Pocket World in Figures, 2006):
1 UAE 214
2 Qatar 206
3 Kuwait 150
Most female population 2005, males per 100 females (Economist Pocket World in Figures, 2006):
1 Latvia 84
2 Estonia 85
2 Ukraine 85
How is a market affected where there are more men than women, or women than men?
Ethnic groups
Japan is a largely homogenous society. The United States is at the other extreme, being made up of many ethnic groups. The first settlers from England are very much a minority and have mostly mixed with peoples who have come from other countries. And many today have origins from elsewhere other than Europe.
According to the 2000 census, the US population was 72 percent white. African Americans were 13 percent, Latin Americans were 11 percent. Of these 5.4 percent were Mexican, 1.1 percent were Puerto Rican, and 0.4 percent Cuban.
Asian Americans were 3.8 percent of the population. The Chinese were the largest group, followed by Filipinos, Japanese, Indians, and Koreans.
Ethnic groups are having an impact on marketing for American business.
Procter & Gamble:
In 2000 the company set up a 65-person bilingual team to target Latino customers. Now the company tailors its products to appeal to Latino tastes.
Kroger – a grocery chain, spent $1.8 million converting a store in Houston to cater for Latinos with Spanish-language signage and products such as plantain leaves and Mexican cocoa.
PacifiCare Health Systems – a California-based insurance company, found that 20 percent of its 3 million policyholders were Hispanic. It set up a new unit, Latino Health Solutions. The unit markets products in Spanish, directs customers to Spanish-speaking doctors, and translates documents into Spanish.
Charles Schwab, the online stockbroker based in San Francisco, recognized the growing power of Asian consumers after the 1990 census. It now employs over 200 people who speak Chinese, Korean, and Vietnamese at call centres dedicated to these customers. They have a Chinese language web site and fourteen Schwab branches are found in predominantly Asian neighbourhoods across the US. (Kotler and Keller, 2006: 82)
However, marketers must be careful not to generalize about ethnic groups. It has to be emphasized that Asians cannot be grouped together as one. There is much that is different between a Chinese and an Indian!
Educational Groups
In Japan, 99 percent of the population can read and write. In the United States by comparison, 10 to 15 percent of the population may be functionally illiterate. However, the United States has one of the highest levels of college-educated citizens at 36 percent. The high number of well educated people creates a demand for quality books, magazines, and a high supply of skills.
Household Patterns
The traditional household containing a nuclear family of two parents and their children is becoming less common. In the US this has fallen from nearly 80 percent in the 1950s to around 50 percent today. (Kotler and Keller, 2006: 83)
The number living alone is increasing. There are childless married couples. There are single-parent families. More children are born outside marriage. More married couples choose to divorce. More are choosing not to have any children. There are more same-sex partnerships.
The products demanded by smaller households are different. The George Foreman grill has been successful by targeting people who live alone and value convenience.
The gay and lesbian market is of particular interest to marketers. The gay and lesbian population may range between 4 and 8 percent of the population. They are more likely to be in professional jobs, more likely to own a vacation home, more likely to own a computer, and more likely to own shares. And they tend not to have children. This group has more spending power.
BBC News online, 'Supermarkets covet Polish spend', 10 September 2006, http://news.bbc.co.uk/2/hi/business/5332024.stm
Leading British supermarkets are stocking up on Polish food to supply the thousands of Poles who have moved to the UK in the past two years. Sainsbury's, Tesco and Asda are all introducing new Polish ranges, keen to tap into the substantial spending power of the UK's growing Polish communities.
Items sold include borsch, meatballs, pickled vegetables and sauerkraut soup. Stores are expected to develop Polish ready meals in the future to try to compete with specialist delicatessens.
Many corner shops, especially in London, have begun stocking imported Polish brands. But the UK's three largest supermarkets are all keen on a slice of the Polish market, with many Poles having significant disposable income and wanting to buy familiar foods. Sainsbury's was first to get its products onto the shelves, according to the Sunday Telegraph, offering 32 types of Polish food last week. The food is currently available in 11 stores including Hendon in north London and Luton in Bedfordshire.
Tesco will start selling its own Polish range this week, ranging from borsch and salt sticks to delicacies such as cabbage-based dish golabki and flaki, a popular soup. Asda is expected to follow suit next month.
Martin Koyce, Tesco's ethnic project manager, told the Sunday Telegraph: "Britain has long been known for its diverse taste in cuisine and this latest venture will only add to that experience. "The types of items that Polish people miss the most and that are in greatest demand are comfort foods such as soup, pickled cabbage and marshmallows covered with chocolate."
About 230,000 Poles registered for work in the UK between May 2004 and March 2006, according to official figures. But the actual number of Poles living in the UK is thought to be much higher, with some estimates putting it as high as 600,000.
4. Individual Buyer Behaviour
(See Kotler and Keller, 2006: 184-199)
Marketing and environmental stimuli enter the consumer’s consciousness. A set of psychological processes combine with certain consumer characteristics to result in decision processes and purchase decisions. The marketer’s task is to understand what happens in the consumer’s consciousness between the arrival of the outside marketing stimuli and the ultimate purchasing decisions.
Four key psychological processes – motivation, perception, learning, and memory – are at work.
MOTIVATION
Some needs are biogenic – they arise from physiological states of tension such as hunger, thirst, or discomfort
Other needs are psychogenic - they arise from psychological states of tension such as the need for recognition, esteem, or belonging
A motive is a need that is sufficiently pressing to drive the person to act. Three of the best known theories of human motivation, from Sigmund Freud, Abraham Maslow, and Frederick Herzberg, carry different implications for consumer analysis and marketing strategy.
Freud
Assumed that psychological forces shaping people’s behaviour are largely unconscious. A person cannot understand his/her own motivations. When a person examines specific brands, he or she will react not only to their stated capabilities, but also to other, less conscious cues. Shapes, size, weight, material, colour, and brand name can all trigger certain assumptions and emotions. A technique called ‘laddering’ can be used to trace a person’s motivations from the stated instrumental ones to the more terminal ones. Then the marketer can decide at what level to develop the message and appeal. (Thomas J. Reynolds and Jonathan Gutman, ‘Laddering Theory, Method, Analysis, and Interpretation’, Journal of Advertising Research, Feb-Mar 1988: 11-34.)
Motivation researchers often collect ‘in-depth interviews’ with a few dozen consumers to uncover deeper motives triggered by a product. They use various projective techniques such as word association, sentence completion, picture interpretation, and role playing.
Different motives a product can satisfy:
Whisky can meet the need for social relaxation, status, or fun. Different whisky brands need to be motivationally positioned in one of these three appeals. (Jan Callebaut et al., The Naked Consumer: The Secret of Motivational Research in Global Marketing, Antwerp, Belgium: Censydiam Institute, 1994.)
According to another researcher, Clotaire Rapaille, the appeal of paper towels relates to a mother’s instinctive desire to have her genes survive. “You are not just cleaning the table. You are saving the whole family,” she says. (Melanie Wells, ‘Mind Games’, Forbes, 1 September 2003: 70.)
Maslow
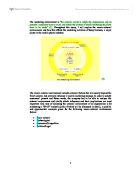
Abraham Maslow (Motivation and Personality, New York, Harper and Row, 1954: 80-106.) sought to explain why people are driven by particular needs at particular times. Why does one person spend considerable time and energy on personal safety and another on pursuing the high opinion of others? Maslow’s answer is that human needs are arranged in a hierarchy, from the most pressing to the least pressing. When a person succeeds in satisfying an important need he/she will then try to satisfy the next most important need.
Maslow’s Hierarchy of Needs (Motivation and Personality, 2nd edition, Upper Saddle River: Prentice Hall, 1970)
5. Self-
actualization
Needs
(self-development
and realization)
4. Esteem Needs (self-esteem,
recognition, status)
3. Social Needs (sense of belonging, love)
2. Safety Needs (security, protection)
1. Physiological Needs (food, water, shelter)
Herzberg
Frederick Herzberg developed a two factor theory that distinguishes ‘dissatisfier’ – factors that cause dissatisfaction – and ‘satisfiers’ – factors that cause satisfaction. (Work and the Nature of Man, Cleveland: William Collins, 1966) The absence of disatisfiers is not enough; satisfiers must be present to motivate a purchase.
For example, a computer that does not come with a warranty would be a dissatisfier. Yet the presence of a product warranty would not act as a satisfier or motivator of a purchase, because it is not a source of intrinsic satisfaction. Ease of use would be a satisfier.
Herzberg’s theory has two implications.
- Sellers do their best to avoid dissatisfiers. It might be a poor training manual or poor service. Although these things will sell a product, they might easily unsell it.
- The seller should identify the major satisfiers or motivators of purchases in the market and then supply them. These satisfiers will make the difference as to which brand the customer buys.
PERCEPTION
How the motivated person acts is influenced by his/her perception of the situation. Perception is the process by which an individual selects, organizes, and interprets inputs to create a meaningful picture of the world. (Bernard Berelson and Gary A. Steiner, Human Behaviour: An Inventory of Scientific Findings, New York, Harcourt, Brace Jovanovich, 1964: 88.)
Perception depends not only on physical stimuli but also on the stimuli’s relation to the surrounding field and on conditions within the individual. The key point is that perceptions can vary widely among individuals exposed to the same reality. One person might perceive a fast-talking salesperson as aggressive and insincere; another, as intelligence and helpful. Each will respond differently to the salesperson.
In marketing, perceptions are more important than the reality, as it is perceptions that will affect consumers’ actual behaviour. People can emerge with different perceptions of the same object because of three perceptual processes: selective attention, selective distortion, and selective retention.
Selective Attention
A person may be exposed to over 1,500 ads or brand communications per day. Because a person cannot possibly attend to all these, most stimuli will be screened out – a process called selective attention.
- People are more likely to notice stimuli that relate to current need. If you are already thinking about buying a computer, you are more likely to notice computer ads.
- People are more likely to notice stimuli that they anticipate. You are more likely to notice computers than radios in a computer store because you do not expect the store to have radios.
- People are more likely to notice stimuli whose deviations are large in relation to the normal size of the stimuli. You are more likely to notice an ad offering £100 off the list price than one offering £5.
Although people screen out much of the surrounding stimuli, they are influenced by unexpected stimuli, such as offers in the mail, over the phone, or from a salesperson. Marketers may attempt to promote their offers intrusively to bypass selective attention filters.
Selective Distortion
Selective distortion is the tendency to interpret information in a way that will fit our preconceptions. Consumers will often distort information to be consistent with prior brand and product beliefs. (J. Edward Russo, Margaret G. Meloy, and T. J. Wilks, ‘The Distortion of Product Information During Brand Choice’, Journal of Marketing Research 35, 1998: 438-452.)
For example, in ‘blind’ taste tests, one group samples a product without knowing which brand it is. Another group does know. Both groups express different opinions even though it was the same product!
For example, one study found consumers equally split in their preference for Diet Coke and Diet Pepsi in a blind taste. Yet when consumers knew the product they were drinking the split was 65 percent for Coke and 23 percent for Pepsi. (Leslie de Chernatony and Simon Knox, ‘How an Appreciation of Consumer Behavior Can Help in Product Testing’, Journal of Market Research Society, July 1990: 333.)
Selective Retention
People will tend to retain information that supports their attitudes and beliefs. We are likely to remember good points about products we already like and forget good points about competing products. This works to the advantage of strong brands.
It also explains why marketers use repetition in sending messages to their target market – to make sure the message is not overlooked.
Subliminal Perception
A picture of a banana lasting for less than a second inserted into a television commercial for a car, for example, would supposedly cause the viewer to want to eat a banana. The viewer is not aware they he/she saw such a picture but still it affects their behaviour.
However, no evidence supports the notion that marketers can systematically control consumers by embedding covert, subliminal messages in ads or packages.
REFERENCES :
(Timothy E. Moore, ‘Subliminal Advertising: What You See Is What You Get’, Journal of Marketing 46, 1982: 38-47; A. B. Aylesworth, R. C. Goodstein, and A. Kalra, ‘Effect of Archetypal Embeds on Feelings: An Indirect Route to Affecting Attitudes?’, Journal of Advertising 28, 3, 1999: 73-81.)