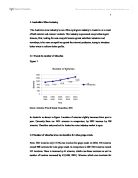
Figure 1 demonstrates the effect of increase in price of traditional energy sources on the households well-being. Two curves U1 and U2 represent all combinations of energy consumption that yields the same level of satisfaction. Two straight lines represent household budget lines. Each household maximizes their satisfaction at the point tagent to utility curve, which is also the intersection between budget line and utility curve. A and B refer to optimal point where household satisfaction are maximised.
Figure 1. Effect of Carbon Tax on economic well-being of households
As indicated in Figure 1, as price of goods produced using carbon-intensive energy rises, quantity demanded on these goods will fall from Q1 to Q2. As a a result, budget lines of households will rotate inward, and utility curve will shift from A to B. Assume income of households do not change in short period, they face the fact that each AUD now buy less patrol and electricity than before the carbon tax applied.
- EFFECT OF CARBON PRICING ON ENERGY CONSUMPTION PATTERN OF AUSTRALIAN HOUSEHOLDS
In producer perspective, traditional energy sources are inputs and will account to final price of goods and services. As price of electricity, fuel increases, all types of business from factories to transportation services immediately adjust output price to maintain the profit. More specific, all goods and services in economy are very likely to raise because of the carbon tax. This leads to a reduction in demand for these goods and services.
-
In short run : demand for carbon-intensive goods is inelastic, since traditional energy source is currently considered as necessity. Other types of energy such as solar, wind, geothermal energy are still more expensive or inefficient compared to carbon-intensive energy. Therefore, households find no incentive to shift to goods using alternative energy sources.
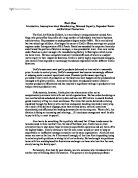
Figure 2 illustrates the situation when an increase in price of goods using traditional energy sources results in a reduction in demand for those goods in short run.
Figure 2. Effect of Carbon Tax on Australian energy consumption pattern
in short run
In short run, large increase in price of goods using traditional energy sources results in small reduction in quantity demanded for those goods. Price Consumption Curve demonstrates the enerrgy consumption pattern of households as price of goods increases. As price of goods increases from P1 to P3, quantity demanded fall from Q1 to Q3. The trend in short run is illustrated as a steep and downward sloping curve, which is indicates an inlastic demand for those godds in the short run.
-
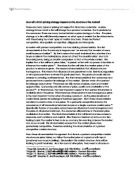
In the long run : The scheme also functionates a AUD$1.2 billion Clean Energy Finance Corporation (CEFC) which will invest in the developmnet of renewable energy, energy efficiency and low emissions technologies (Deloitte 2011). As other alternative sources of energy are cheap enough due to innovations, households might switch from carbon-intensive energy to alternative energy. Another assumption is the increase in income of households in the long run. A small increase in price of traditional energy causes a large reduction in quantity demanded for this source. This indicates a elastic demand for goods using carbon-intensive source in the long run as being showed in Figure 3.
Figure 3. Effect of Carbon Tax on Australian energy consumption pattern
in long run
In the long run, households well respond to any change in price of carbon-intensive goods and services. Small increase in price of these goods results in large fall in quantity demanded. It is reflected in the relatively flat demand curve. This trend implies a significant substitution between carbon-intensive energy and alternative energy. This also proves the effectiveness of the Carbon Pricing in reducing the greenhouse gases.
- EFFECT OF COMPENSATION SCHEME ON HOUSEHOLDS
As expected, there is significant compensation for households with the focus on low-to-middle income households. According to The Australian Newspaper, total amount of money paid by companies will be around AUD$12 billion. Approximately 50% of revenue generated from the scheme will be used to compensate households.
- Income and Substitution Effect on Carbon Tax
In short-term, the proposal of carbon tax will increase the price of all goods using traditional energy sources. Moreover, non-traditional energy sources yet to be a substitute goods because of high price. Figure 4 shows the effect of carbon tax on households in terms of income and substitution effect.
Figure 4. Income and Substitution Effect of Carbon Tax on households
Electricity and patrol are considered as normal good. The original budget line is L1, and optimal point is at A. Any increase in price of goods on horizontal axis will make the budget line rotates inward from L1 to L2. Under the new budget line, households maximize utility at point B.
“Substitution effect is the change in a good’s consumption associated with a change in the relative price of the good, with the level of utility constant”. “Income effect is the change in consumption of a good resulting from an increase in purchasing power, with relative prices held constnt.” According to diagram, substitution effect arises from the increase in price of traditonal energy sources is F1E, which moves from A to D. Income effect is EF2, which move from D to B. As a result, the reduction in demand for goods is the combination of substitution and income effect.
- Effectiveness of compensation plan
Estimatedly, 50% revenue generated from tax on firms will compensate low-to-middle families via changes in tax and payment systems (MPCCC 2011). Through rebate programme, a part of income reduced due to the increase in price of good will be given back to households. However, the magnitude of rebate programme is still being considered. In case if cash giving back to taxpayer equals to income effect, the total effect will exactly equals to subtitution effect as showed in Figure 5. Although this action does not completely remove the effect of carbon tax on households, but it reduces the burden on carbon tax faced by households.
Figure 5. Compensation effect on Australian households
- Effect of compensation plan on energy consumption pattern
The compensation programme gives back a portion of revenue generated from the Carbon tax on large companies to households. This leads to an increase in income of Australian households, which shifts the budget lines outward. Australian households energy consumption pattern will be affected by changes of income. Income consumption curve (ICC) demonstrates the energy consumption pattern in the consideration of changes in income.
Figure 6 shows two different ICCs. ICC1 and ICC2 shows the energy consumption pattern before and after the compensation programme takes place accordingly. As income increases, households can buy more goods. In long run, households tend to consume less carbon-intensive goods and switch to low-carbon goods at each income level. ICC is therefore steeper than before the payments system comes into effect.
Figure 6. Compensation effect on energy consumption pattern of households
- CONCLUSION
The purpose of this paper is to indentify and evaluate the effect of Carbon Pricing Mechanism on Australian households through economic matters. The very first impact appears to have detrimental effect on households income, especially low to middle household group. This group accounts for a large proportion of Australian population. For this reason, there are numerous debates around the feasibility of this scheme. Some pessimists argue this scheme would lead to high unemployment and weakening Australian purchasing power as the result of price increase. However, applying new scheme receives positive feedbacks from environmental activists and promisely to create a cleaner Australia. It is too hasty to jump on conlusion whether this scheme succeeds or not. All the matter will be answered in the most comprehensive way no sooner than 3 years from now.
REFERENCES
Amanda Seaton. 2011. Australia’s carbon pricing mechanism. Sydney : Johnson Winter & Slattery.
Andrew P. 2011. Australian Federal Government’s Proposed Carbon Pricing Mechanism. BlueScope Steel. http://www.bluesopesteel.com (accessed August 28, 2011)
Carbon Price Mechanism. 2010. Multi-Party Climate Change Committee, December 21. http://www.climatechange.gov.au/government/initiatives/multi-party-committee.aspx (accessed August 28, 2011)
Deloitte. 2011. Australia’s carbon pricing mechanism. Key issues forbusiness. http://www.deloitte.com (accessed August 28, 2011)
Robert, S. P. and Daniel L. R. 2009. Microeconomics. Seventh edition. United States of America. Pearson Prentice Hall.
Vincent, D, N. Vyrnwy-Jones 2011. The carbon pricing mechanism: a power industry focus. http://www.mondaq.com/australia/x/140406/Oil+Gas+Electricity/The+carbon+pricing+mechanism (accessed August 26, 2011)