The higher the Market Value Added (MVA), the better. Dixons MVA was gradually decreasing, this means that value has been destroyed and corrective actions should be undertaken in order to correct that and create the shareholder value as alleged to be.
Economic Value Added (EVA) is an estimate of the amount by which earnings exceed or fall short of the required minimum rate of return for shareholders or lenders at comparable risk. It can be used for performance evaluation over time. It can be calculated using the following formula:
EVA= NOPAT – (Invested Capital * Cost of Capital)
where NOPAT is the Net Profit After Tax = Operating Profit – Tax
EVA of Dixons shows that with risk 6% the amount of earnings to minimum required rate of return has been increasing throughout all 6 year period.
Key ratios for financial analysis are Return on Capital Employed (ROCE), Capital Gearing ratio, Price/Earnings ratio (PE), Working Capital ratio (WC), Operating Profit Margin. Earnings per Share (EPS) are also used to determine corporate value.
Display 2: Summarising table of ratio results.
The Return on Capital Employed ratio (ROCE) indicates the efficiency and profitability of a company's capital investments. It should always be higher than the rate that the company borrows at, otherwise any increase in borrowings will reduce shareholders' earnings. According to the company’s accounts from 1998 to 2003 the borrowing rate was always lower that ROCE, which means that Dixons’ investments were generally doing well. ROCE is declining until 2001, when per each £1 of sales, the company made just about 24p after meeting its direct and overhead expenses, it then goes down to 20p in 2003, which still shows quite good performance.
In order for a business to maximise profitability, management should consider the two elements of ROCE. First, the business needs to sell goods and services at a price that exceeds the cost, which is measured by the net profit margin. Secondly, the business must use the capital employed in the business to
generate sufficient sales volume and revenue to maximise profitability, which is measured by the net asset turnover. The relationship between the two elements of ROCE can therefore be expressed as follows:
ROCE = Net Profit before Interest & Taxes x Sales Revenue
Sales Revenue Capital Employed
= NET PROFIT MARGIN X NET ASSET TURNOVER
According to results of Profit Margin found in the table of ratios, pricing strategy of Dixons is quite successful, even if ratios are small. Small ratios which tend to decrease can be explained by their dependence on Dixons external environmental factors like heavy competition and general change in industry and market conditions.
Asset Turnover ratio is useful to determine the amount of sales that are generated from each pound of assets. Companies with low profit margins tend to have high asset turnover, those with high profit margins have low asset turnover. For companies in the retail industry, like Dixons in our case, a high turnover ratio can be expected - mainly because of competitive pricing.
Acid Ratio, which is calculated as Current Assets/ Current Liabilities, indicates if a firm has enough short-term assets (without selling inventory) to cover its immediate liabilities. Therefore, looking at the ratios, it seems like the company has just enough liquid assets to cover an unexpected drawdown of liabilities. However, ratio is a bit low in 2003.
Working Capital ratio is designed to show how much working capital is required to support turnover, and provides an indication of overall working capital needs. The formula is
Stocks + Trade Debtors – Trade Creditors
WC= Turnover
Dixons’ working capital to sales ratio is decreasing, thus WC need in relation to sales is diminishing. Increasing sales by £100m will require the company to fund additional working capital needs £1.39m in 2003 as opposed to £2.12m in 1999.
EPS suggest that the rate of growth a company grows at is increasing on the per share basis. In our case it fluctuates quite significantly, thus Dixons needs to implement some change in order to more or less stabilise earnings.
P/E ratio is one of the most widely used ratios, it compares the current price with earnings to see if a stock is over or under valued. On average P/E ratio should be 20-25, and in 2001 this ratio shows that Dixons was quite successful. However, the current P/E ratio is just 12.3, thus the company should not expect much in future. But it does not necessarily shows that a stock is undervalued, it can also indicate a slow growth or financial trouble
Debt-Equity ration= Total Liabilities/Shareholder’s Equity indicates what proportion of equity and debt that the company is using to finance its assets. Dixons ratios are quite reasonable and the distribution of share capital and debt is well structured.
Shareholder Value Analysis
Shareholder Value Analysis (SVA) demonstrates how decisions affect the net present value of cash to shareholders. The analysis measures a company's ability to earn more than its total cost of capital. This tool is used at two levels within a company: the operating business unit and the corporation as a whole. Within business units, SVA measures the value the unit has created by analyzing cash flows over time. At the corporate level, SVA provides a framework to assess options for increasing value to shareholders: the framework measures tradeoffs among reinvesting in existing businesses, investing in new businesses, and returning cash to stockholders.
Rappaport’s value drivers that are considered to determine the value of the company:
- Sales growth – 15.79% based on revised pricing strategy. Seems to be appropriate according to the increasing number of shops and products in Dixons Group.
- Operating profit margin – 6.16 % seems credible due to Dixon’s clear cut pricing strategy.
- Working Capital investment – 23.22 % is reasonable considering the amount of total capital invested each year into the group.
- Fixed Capital investment (FCI) 6.79 %additional shareholder value can be created if more capital is invested in the company. For these calculations we have assumed that the Incremental FCI rate of
year 2000 is not representative and can be removed from the formula. In 2000 Dixons has made significantly larger investments comparing to other years.
- WACC- 6.00% An expression of the cost of capital is used to see if certain intended investments or strategies or projects or purchases are worthwhile to undertake. WACC is a minimum return that is needed on an investment within a firm that will be needed to satisfy the lenders and will leave just enough to give shareholders their return. Otherwise shareholders will quickly recognise that 6% is available elsewhere for that level of risk. Dixons works with a WACC of 6%, this means that only (and all) investments should be made that give a return higher than the WACC of 6%. The anwer is based on the assumption that return on the market is calculated on the basis of 15 years FTSE All Share Index, and the risk free rate is based on 3 Months UK Treasury Bills rate.
- Tax rate – 30%. Assume there is no change in government policy.
- The planning horizon – set at six years, as longer period regarded as uncertain.
Although there are numerous advantages to SVA such as the ease of application, consistence with share valuations as it is based on DCF techniques and actual value drivers can help managers to focus and target better performance. However, there are still some disadvantages of SVA. Such as:
- Invariable percentage raise in value drivers is short of realism.
- Target setting of some value drivers may force managers to implement short-term approaches to come up with cash flow requirement for the year.
- Some data may be difficult to get as firm accounting systems may not be equipped to provide this data, as well as costly to provide new installation.
- As estimations are based on past information it does not predict well the future.
- Investment returns estimated are hard to measure as returns may be spread over years and closely interlinked with other features.
Display 3: Shareholder Value Analysis table
Residual Value= Future Free Cash Flow/Discount Factor
PV of RV= RV/(1+Discount Factor)^6, 6 years forecast
Business Value=PV of RV+PV of all FCV
Corporate Value= Business Value + marketable securities
Shareholder’s Value= Corporate Value – Debt
Price= Shareholder’s Value/ Number of Shares
The current market price of £1.1984 is much lower then the price calculated using SVA. This can be due to the fact, that for calculating Incremental FA we did not take into account the 2000 rate because it is not really representative.
Dividend Discount Model
The Dividend Discount Model is a valuation tool used to determine the present value of a company's stock or the stock’s expected rate of return to see whether the current stock price is under- or over-valued.
D1
P= R-g
Where P is the price of a share
D1 is a future dividend
R is the required rate of return on equity and equals to (D1/P0)+g
g is the growth rate which is equal to Retained Ratio * Return on Retained Earnings.
According to Bloomberg, Dixons Retained Ratio is 37.82% and it’s Return on RE is 12.68%. Thus, growth rate g is 4.8% per annum. Having found R, which is equal t0 10.6%, we came up with the P=£1.1984.
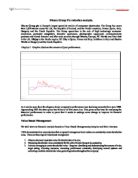
The current market price is completely equal to the one we have calculated, which means that Dixons’ stock price is set correctly. The following is the forecast of Dixon’s future share prices, calculated using Dividend Discount Model.
Overlooking the results that were generated by using the Shareholder Value Analysis (SVA) we can conclude that SVA in case of Dixon Group Plc is not exceptionally representative in terms of valuing the share prices. To allow comparison between accuracy of models: Dividend Discount Model (DDM) was produced alongside of SVA. The results approved of our earlier reservations regarding to SVA and confirmed the precision of DDM results. SVA generated share prices of £3.93 per share which varied considerably from the actual market share price at a time of £1.19 per share. As opposed to DDM which enabled the attainment of exact market share price at £1.19.
As we can see from three tables given above, the risk of increase/decrease of value drivers, the company might undertake, would not really have a significant impact on share price, and would not drive it lower than current market price£1.19. However, the result can be affected by SVA, which turns out to be not very suitable for Dixons Group Plc. On the other hand, SVA might help managers to set additional financial goals to achieve certain shareholder’s value maximisation and continue monitoring these strategic issues which are core to the business as a whole as stated in the mission statement of a company which is set out to maximise the shareholder’s wealth.
Dixons Group Plc Valuation Analysis.
To: Financial Director
Dr. H. Thapar
From: Analysts
E. Chalova
Z. Sandomirova

![National Grid Group (The) PLC[1] - Case study.](https://mbt-essays-prod-public.s3.eu-west-1.amazonaws.com/51489/listing/51489_1.jpg)