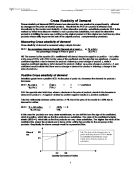
% Change in the Quantity of B / % Change in Price of Good A
The calculation of the CPED will produce a value. This value will indicate the characteristics of the CPED. For instance;
- Between zero and one (inelastic) - quantity demanded of good B changes by a smaller percentage than the change in price of good A
- Between one and infinity (elastic) - quantity demanded of good B changes by a larger percentage than the change in price of good A
The sign indicates if the goods and substitutes or complements. For instance, substitutes have a positive sign and complements have a negative sign.
The following is an example of how to calculate the CPED;
Original price of good A = £8
Original quantity of good B = 20 units
New price of good A = £7
New quantity of good B = 25 units
It is evident that a £1 fall in price of good A, results in a 5 unit increase in the quantity demanded of Good B. The price elasticity of demand is
% Change in the Quantity of B / % Change in Price of Good A =
+25% / -12.5% = -2
Therefore, the cross price elasticity of demand is -2.00, which is termed as relatively elastic. The sign implies that the two goods are complements.
What Use Is This To A Business?
Knowledge of the cross-elasticity of demand can tell an organisation how consumers view their rival’s products. This can then be used to influence the pricing strategy that the organisation follows.
If the organisation has a range of products cross-elasticity can explain the relations of the different products and explain joint-product pricing.
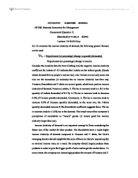
There are degrees of cross-elasticity. A small positive value for cross-elasticity suggests that, although the two products that are substitutes of each other, there is only a weak relationship between them.
A good example of this can be a large rise in the price of tea. This will only cause a relatively small increase in the demand for coffee. This shows that coffee is a substitute product but has a weak relationship whit tea. most people will argue to even though there is a sharp increase in the price for tea, most consumers drinking patterns will not change.
The same type of analysis would be true for products with a small negative number, although the products will be complimentary goods the relationship between them will be a weak relationship.
A firm can use this date to establish whether to change their pricing strategy and the impact it will have on their substitute or complementary goods.
An owner of a tea plantation can use this data to establish what impact it will have on sales of tea is there is a price increase.
As established the impact will be small but then again it would be an ideal idea to look at rival tea products.
If the tea plantation owner knows that there is strong loyalty for his product then it will cause no or little adverse effect to an increase in his products price.
However if there is little or no customer loyalty in his product then consumers will undoubtedly change products and buy rival products.
Using this date would help managers of firms and organisations establish links between their products and others and help them to determine pricing strategies.
Most organisations would look whether the value of cross elasticity of demand is positive if negative and /or how close/far are they to zero.
If the answer is positive, they will try to establish when do the two products become substitutes? This is a judgement made by the organisation with different organisation using different values. For some organisation a value of 1 for cross-electricity of demand would represent a strong substitution effect, while for others it would imply a weak substitution effect. All that it is possible to say that if the value for cross-elasticity is than 1 to 3 then the substitution effect is becoming more and more stronger.
How Can An Organisation Use Cross-Elasticity of Demand?
A organisation may use cross-elasticity of demand in a number of ways once it has established the relation withs its substitute
Case Study: The Times Versus Daily Telegraph
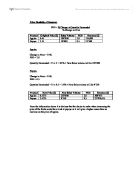
A interesting case study occurred when the Times in July 1993 decided to reduce its price from 45 pence to 30 pence and to the subsequent reduction to 20 pence at the end of June 1994. This decrease in price had a definite impact on sales for the Daily Telegraph and other quality newspapers as the table below shows:
Average daily broadsheet newspaper circulation
Source: Audit Bureau of Circulation.
It is possible to calculate the cross-elasticity of demand for the Daily Telegraph, Independent or any of the other quality newspapers. For example taking the independent, the cross-elasticity with the times is 0.45. The cross-elasticity with the Daily Telegraph is 0.05. For both papers the cross-elasticity calculation makes the assumption that all other factors remain constant. In additional, both cross-elasticities are positive, suggesting that both the Independent and the Daily Telegraph are substitutes for the Times, though in the Daily Telegraph’s case it is only a weak substitute, which indicates strong brand loyalty.
By June 1994, the Daily Telegraph has seen sales fall below the 1 million mark, and the paper responded with a price cut from 48 pence to 30 pence. This was followed shortly thereafter by a cut in the price of the Times to 20 pence. By the middle of 1994, the sales of the Daily Telegraph had begun to rally; the sales of the Times continued to rise while those of the other quality newspapers continued to fall.
Source: Business Economics
Authors: Mark Cook & Corri Farquharson
Published By: Financial Times Prentice Hall 1998