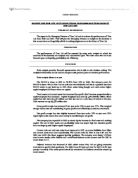
Table 1. Main Information (Source: Annual Financial Reports for 2001, 2002, 2003)
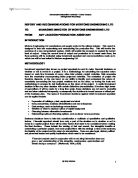
Table 2. Working capital and liquidity ratios
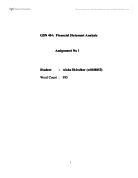
Table 3. Management Efficiency
3. Discussion
Woolworths, Coles Myer, and David Jones are all cash sales businesses unlike companies who sell items on credit like oil drilling industries, which explains lower Days receivable ratio. In fact, David Jones, an upmarket department store, has reduced the ratio by 40% from 2001 to 2003 (Table 3). It puts aside provisions for doubtful debt because of its credit card business but the ratio shows tight control on cost management. Coles Myer’s Days receivable ratio suggests that they are collecting cash quickly like Woolworths but the ratio appears distorted when we compare revenue from department stores (38%) and groceries (61.2%) in 2003
(Table 3, Appendix 1). This will be clearer when we discuss the Days inventory ratio.
The Days payable ratio shows that Woolworths takes longer to pay its creditors than Coles Myer. This works in favour of Woolworth because their operating cycle (Days receivable + Days inventory) is less than Days payable. Therefore, Woolworths transaction intensive business runs its operations with supplier’s money and manages this effectively by using this as a non-interest bearing liability. This is also reflected in Woolworths negative working capital, current ratio, and acid-test ratio figures. Thus to have current assets less than current liabilities is favourable in a grocery business, as cash has to inflow every day. On the other hand, this ratio for David Jones went up from 56 to 61 days from 2002 to 2003 and its liquidity declined in the same period (Table 2 and 3). According to Gibson (2004), this indicates inability to pay short-term debt. It could also be an impact of losing $84 million from failed Foodchain and online retailing strategies, or an affect of change of CEO in September 2003. (Bartholomeusz, 2003)
Amongst the three organisations, David Jones’ Days inventory ratio is highest. It sells its inventory in 97-106 days whereas Coles Myer takes 52- 59 days (Table 3). The 40 days lag is because David Jones niche focus is on luxurious goods like clothes, shoes, accessories, home-ware, and other items with lesser turnover. Their revenue from department store was 97% in 2003 but the profit went down to one-eighth from 2002. Similarly, liabilities for these items went up from 12% in 2002 to 50.5% in 2003 (Appendix 1). This shows that management needs to focus on reducing Days inventory ratio, which has been constant in 2002 and 2003 (97 days). They need sufficient inventory to satisfy customers because it costs money to hold it, store it, and there is an increased risk of obsolescence.(Hey-Cunningham, 2002 p. 229) .If we look at the grocery giants, Woolworths takes 19 days less than Coles Myer to sell its inventory. Its sales revenue figures in food, liquor, and grocery items for 2003, were 86.4% in such high turnover items against Coles Myer’s 61.4%. Woolworths Days inventory ratio has gone down by 15.5% from 2003 against Coles Myer’s 11.5% in the same period. All these show Woolworths efficient management skills.
4. Conclusion
On the basis of the analysis of financial data of Woolworths, Coles Myer, and David Jones for years 2001 to 2003, following conclusions may be drawn on their working capital management practices.
- Woolsworths Supermarkets used 57% of total assets, generated 86.4% sales revenue and delivered 97% of total profit in 2003. These figures reflect their effectiveness in managing debtors, creditors, and inventory. This success is also attributed to Project ‘Refresh’ programme, which helped in reducing Days inventory ratio, and has put more emphasis on better supply chain management.
- David Jones has control on debtors but there is a scope to reduce days inventory ratio and cost of operations. This is important because department stores accounted for 89.5% of total assets in 2003. The latest 2003/2004 financial results are however showing positive turnaround as department store operation has shown profit before tax and unallocated expenses of $67.885m, up from the $5.075m achieved in 2003. (AAP, 2004)
- Coles Myer profits from food and liquor items have gone up from 2001 ($514.7m) to 2003 ($566.7m) and from 18%(2002) to 33% (2003) in department stores (Appendix 1). There has been a drop in days receivable and days inventory ratio from 2001 to 2002, which indicates better management efficiency. However, the increase in Days payable ratio, same liquidity, and days inventory from 2002 to 2003(Table 2 and 3) shows that managers need to focus on inventory management to deviate from selling assets or increasing liabilities to pay creditors, like taking overdraft of $10.8 million in 2003.
Bibliography
AAP (2004) In The Age.
Bartholomeusz, S. (2003) In The Age. Melbourne.
Gibson, C. H. (2004) Financial Reporting & Analysis: Using Financial Accounting Information, Mason, Ohio: South-Western: Thomson.
Hey-Cunningham, D. (2002) Financial Statements Demystified, St Leonards, N.S.W.: Allen & Unwin.
Appendix 1
Segment Information for Woolworths Ltd, Coles Myer Ltd and David Jones Ltd.
** This figure is taken from 2003 Coles Myer balance sheet. There is a difference of $590 million between 2003 and 2002 receivable figures, which is shown to be invested as short-term deposits. The 2002 figure has been ignored for consistency in the data.
* As all the three companies primarily have cash sales and high inventory turnover, therefore we take out property, plant, equipment and other assets but instead keep inventories in the current assets figure to calculate acid-test ratio
1 Supermarket for Woolworths comprises supermarket stores, liquor stores and petrol canopies. For Coles Myer it consists of groceries and liquor.
2 Department Stores for Coles Myer comprises of MGB & Megamart, Target, and Kmart & Officeworks. For David Jones these are department stores, rack stores and online sales
3 Other for Woolworths is BIG W, DSE, and Wholesale. For Coles Myer this segment includes e-commerce trading, property and unallocated. For David Jones these are Foodchain and David Jone’s Credit card.