The Balance of Payments- Data question (page 196)
Question 1
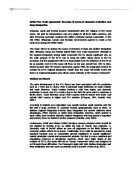
The visible trade balance in figure 30.6 illustrates changes in the balance of trade. This is the difference between exports (which bring money into the country) and imports (money leaves the country). The data informs us there has been a balance of trade deficit in the UK from 1985 to 1999 although this figure has been on varying levels. In the beginning of the period the deficit is £2billion. This reduces to just under £0.5 billion and nearly reaches a complete balance of no deficit or surplus in 1986. The value fluctuates yet steadily rises to reach the highest deficit value of just under £7billion in 1989. The deficit falls in value slowly and reaches a low of only £2 billion deficit in 1992. The value increases to £4billion in 1993 and then fluctuates between £2 billion and £4 billion from 1993 10 1997. From 1997 there is a rapid increase in the deficit and it reaches a value higher that £7billion deficit in 1999.
The total investment is shown to be positive due to figure 30.7. The approximate average investment (sum total of years investment divided by number of years is £4bn per annum. Over the whole period £56.25 billion is pent on investment. Initially form 1985 the values of investment is low and peaks at £4billion in 1986. The net investment slowly declines from 1989 and is least at 1991 at -£2billion. After 1991 there is a increase in investment. This increase is rapid and from 1993 (approximately £1 billion) to £8billion in 1994. Following this the increases are steady and the highest level of investment is in 1998 at £16 billion.
Question 1
The visible trade balance in figure 30.6 illustrates changes in the balance of trade. This is the difference between exports (which bring money into the country) and imports (money leaves the country). The data informs us there has been a balance of trade deficit in the UK from 1985 to 1999 although this figure has been on varying levels. In the beginning of the period the deficit is £2billion. This reduces to just under £0.5 billion and nearly reaches a complete balance of no deficit or surplus in 1986. The value fluctuates yet steadily rises to reach the highest deficit value of just under £7billion in 1989. The deficit falls in value slowly and reaches a low of only £2 billion deficit in 1992. The value increases to £4billion in 1993 and then fluctuates between £2 billion and £4 billion from 1993 10 1997. From 1997 there is a rapid increase in the deficit and it reaches a value higher that £7billion deficit in 1999.
The total investment is shown to be positive due to figure 30.7. The approximate average investment (sum total of years investment divided by number of years is £4bn per annum. Over the whole period £56.25 billion is pent on investment. Initially form 1985 the values of investment is low and peaks at £4billion in 1986. The net investment slowly declines from 1989 and is least at 1991 at -£2billion. After 1991 there is a increase in investment. This increase is rapid and from 1993 (approximately £1 billion) to £8billion in 1994. Following this the increases are steady and the highest level of investment is in 1998 at £16 billion.