Experiment 2:
This involved temperature measurement; this was done by setting up the circuit as in experiment 1 however this time a temperature sensor was attached and one of the multi meters was set to measure temperature. The temperature probe was then attached to the multi meter and resistor and the supply voltage was set at 2V first of all and after the temperature had stabilised the measurement was recorded, this was then repeated 5 times using increasing voltages of 4V, 6V, 8V and 10V.
Experiment 3:
For this experiment the switch was connected to the coil of the relay and the voltage source. The voltage supplied was set at 10V and the switch was turned on. The coil was then placed near to a strip of metal and the observation was recorded then after this the conductor was separated from the coil and the observation was recorded again.
Experiment 4:
This experiment was simply just connecting an electric fan to a power source; to do this the fan motor was connected to the power supply through the switch. The observation was noted.
Experiment 5:
The first step in this experiment was to set the power supply to a maximum of 1A. A wire was then connected to the supply and the switch and then placed over a magnetic compass. The switch was turned on and the observation was recorded. The experiment was then repeated but a coil was used this time instead of just loose wire to see if there was any difference in the result. An iron core was then inserted into the coil and the experiment was repeated to see this if this had any effect on the result.
Results
Below are the results for experiment 1 showing the data for the resistor in series.
Table 1 showing the voltage at terminal and current at different voltage supplies.
The value of the current is determined by ohm’s law which is. This had to be rearranged to give the formula of a straight line graph with ‘R’ being the gradient to give . A graph of current against voltage was then drawn in order to confirm the value of the resistor.
The graph is shown below.
Graph 1 showing voltage against current for a resistor in series.
From this graph we can see that there is positive correlation between the voltage supplied and the electrical current and by calculating the gradient the gradient was found to be 100.05Ω.
The power needed to work an electrical component can be determined by the current flowing through it and the voltage applied. It can be calculated by using the following equation:
The power can now be calculated from the values in table 1.
Table 2 showing voltage current and power of a resistor in series.
From these results we can see that the power used by the resistor increases as the voltage and current increase. This could be due to the power being dissipated as heat resulting in a temperature rise in the component which is what happened in experiment 2.
Next the experiment was carried out with 2 resistors in parallel. Below are the results of this experiment.
Table 3 showing data for 2 resistors connected in parallel.
This data then needed to be presented in a graph in order to allow us to see the trend more clearly.
Graph 2 showing voltage vs. Current when 2 resistors are connected in parallel.
From the graph we can see that when the resistors are connected in parallel there is positive correlation between the voltage input and current.
Finally, the experiment was carried out with 2 resistors connected in series. Below is the data for this experiment.
Table 4 showing the data when 2 resistors are connected in series.
This data was then represented in a graph of voltage against current.
Graph 3 showing voltage against current when 2 resistors are connected in series
Again it is clear to see a positive correlation between current and voltage on this graph.
Results from Experiment 2
Table 5 showing how temperature is affected when voltage input is altered.
This data needed to be represented in a graph in order for the trends to be more apparent.
Graph 4 showing temperature against voltage.
It is apparent from the graph that as voltage input is increased the temperature either remains the same or rises slightly.
Experiment 3
There were no raw results for experiment 3 as it was an observational experiment. When the switch was pressed the yellow LED switched off and the green LED switched on.
Experiment 4
Experiment 4 was also an observational experiment, when the power supply was switched on the fan rotated in an anti-clockwise direction.
Experiment 5
For experiment 5 when the wire was positioned over the magnetic compass the compass needle pointed towards it. Also when the wire was coiled the needle still pointed towards it even when it was positioned further away from the compass which suggests a stronger magnetic field.
Discussion
Experiment 1
From the results obtained in experiment 1 it is clear to see that the current in parallel circuits is higher than it is in a series circuit. This could be because in a parallel circuit the overall resistance is the total of the inverses of all the individual resistors, however in a series circuit it is just the sum of all resistors. Hence, the total resistance in a parallel circuit is always smaller than the resistance of any of the individual resistors in the circuit.
Experiment 2
From the results in experiment 2 it is obvious to see that as the voltage input is increased the temperature also increases. The power consumption also rises with the increase in voltage which could explain the temperature rise as some of this power is dissipated as heat resulting in a temperature rise. This is known as a process called drifting which is when an electric field is used to accelerate electrons which results in the electrons gaining some kinetic energy. After this a collision with another atom is inevitable and the electrons lose some of the acquired energy which results in a drift in the positive direction (Lesurf 2002). By increasing the voltage the rate at which electrons accelerate is also increased which means more energy is lost from the electrons during a collision. This energy is transferred to the atoms causing them to vibrate and therefore the electrical energy is converted to heat energy.
Experiment 3
This experiment involved a relay SPDT – which stands for Single Pole Double Throw which is the reason for the yellow LED switching off and the green LED switching on. When the switch is pressed, the electrical current flows to the relay and is then transferred to another part of the circuit using an electromagnet hence the green light switching on. As expected when the switch is released the yellow LED switches on again due to the electromagnet being deactivated.
Experiment 4
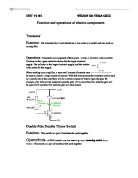
The observed spinning of the fan is down to electromagnetic induction. When the polarity was switched the fan started spinning in the reverse direction due to a phenomenon called the ‘motor effect’. If a conductor is placed at a right angle to an external magnetic field with an electrical current flowing through it then a force is created which is perpendicular to the direction of the current and the external magnetic field. If the polarity is reversed then the electrical current also changes, therefore causing a change in the resultant force. (DIRACDELTA 2009) This can be attributed to Flemings right hand rule which is a way of determining the direction of the induced emf of a conductor moving in a magnetic field. (DIRACDELTA 2009) The diagram below helps to explain this concept.
(DIRACDELTA 2009)
Experiment 5
In this experiment the compass’ needle moved towards the wire because of the interaction magnetic and electric fields of the wire and compass. When the iron core was inserted into the coiled wire it became a much stronger magnet due to the interaction of the magnetic and electric field becoming stronger.
Conclusion
From the results of the experiments on it can be said that electrical circuits are able to be manipulated for different uses, which is very useful in industry. It can also be concluded that a changing magnetic field results in an electric field, this is known as electromagnetic induction which is heavily used in engineering for example in transformers and electrical generators.
References
ALLABOUTWORDS 2009.[online] [Accessed 18 November 2009] available from:
ALLABOUTCIRCUITS 2009. [online][Accessed 18 November 2009] available from:
LESURF, J. 2002. University of St.Andrews. Resistors: Basic Properties [online].[Accessed 18 November 2009]
Available from:
DIRACDELTA. 2009.Fleming's Left Hand Rule [online].[Accessed 19 November 2009]
Available from: