The first variable I shall look at is Media influence.
Based on v5 "Which paper do you read most often?" Q2b.1. Again I have simplified this to show those papers perceived to have left wing bias, those perceived to have right wing bias and those who appear to have little or no bias (here described as Independent of bias). Obviously some papers could be seen to straddle two or even all three groups, but for simplification I will group them as:
Right wing bias - The Sun. Daily Mail. Daily Star. Daily Telegraph. Today.
The Times.
Left wing bias - Daily Mirror/Record. The Guardian.
Independent - Financial times. The Independent.
v216. Media bias.
1. Left wing.
2. Right Wing.
3. Indy.
9. Missing Data.
The skewness of this variable is 0.24 which reflects the relatively high right wing bias in the British press, it is still not however too high to disregard. there are 3287 cases missing here which may prevent this indicator from having much reliability.
The second variable is region. this is based on variable v1 "Registrar Generals' Standard Region", and has been collapsed into broad regions to help with analysis.
Areas in the North are; North, North West, Yorkshire and Humberside.
Areas in the Midlands are; West Midlands and East Midlands.
Areas in the South are; South West, South East and Greater London.
Wales and Scotland stand on their own.
v218. Broad area where R comes from.
1. North.
2. Midlands.
3. South.
4. Wales.
5. Scotland.
9. Missing Data.
The skewness of this variable is 0.08 which shows a very close distribution to the normal curve. It has 1792 cases missing which does not prevent this from being a good .
The third variable is age. Based on the variable v177 "Age of respondent (banded)." It was necessary to collapse two groups into one to create 55-64 years old thereby keeping all the groups equal.
v219. Age of respondent (banded).
1. 18-24 years old.
2. 25-34 years old.
3. 35-44 years old.
4. 45-54 years old.
5. 55-64 years old.
6. 65 or over.
The level of skewness for this table has been measured at 0.02, which shows a good distribution within the groups.It has 1747 cases missing which does not prevent this from being reliable.
The last variable is income. Based on variable v171 "Total income of Household all source." I have collapsed the table to allow easier analysis and also to make the class boundaries more consistent in terms of frequency and spread.
v220. Total income of household all source.
1. Less than £3,999.
2. £4,000-£7,999.
3. £8,000-£11,999.
4. £12,000-£17,999.
5. £18,000-£22,999.
6. £23,000-£28,999.
7. £29,000-£34,999.
8. £35,000 and over.
9. Missing Data.
The level of skewness for income is 0.44 which is relatively high but I feel not high enough to warrant it not being used. It also has 2150 cases missing which also does not exclude it.
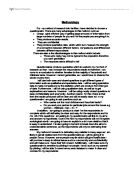
iii) Hypotheses.
1. Older people are more likely to vote Conservative than younger people.
2. The type of newspaper an individual reads in terms of political bias predicts the way they are likely to vote.
3. People who live in the South are more likely to vote Conservative. People who live in the North are more likely to vote Labour.
4. The higher an individuals income, the more likely they will vote Conservative. The lower an individuals income, the more likely they will vote Labour.
Findings and Discussion.
Bivariate Analysis.
Hypothesis 1: Older people are more likely to vote Conservative than younger people.
Table 1.
Age / Vote. Conservative. Labour. Other. Sum. N= 18-24. % 36.7 36.3 27.0 100.0 281 25-34 % 39.1 35.7 25.3 100.0 586 35-44 % 38.5 34.2 27.4 100.0 559 45-54 % 46.2 30.8 23.1 100.0 520 55-64 % 41.5 37.2 21.3 100.0 441 65+ % 47.9 36.1 16.0 100.0 570 AVE 42.0 34.9 23.1 100.0 2957
Null hypothesis: There is no relation between age and voting.
Table 2.
Chi Square 36.121 Significance 0.0001 Degrees of freedom 10 Gamma -0.099
As can be seen, the chi square test fulfils the critical value and it is safe to reject the null hypothesis with a high level of confidence. Therefore, there is a relationship between age and voting. It shows that these findings can be confidently generalised onto the general population. The gamma statistic shows that the amount of error is reduced by almost 10%. That is 10% of the variation in voting can be explained by age. This may not sound numerically significant but it explains 10% of why an individual votes a certain way. Table 1 shows that the percentage of individuals who vote for the Conservative party increases as age increases, whereas the percentage of those voting Labour decreases as age increases, although it does tend to rise again in the last two groups.
Hypothesis 2: The type of newspaper an individual reads in terms of political bias predicts the way they are likely to vote.
Table 3.
Vote / Paper Left Right Indy Total Con % 15.8 79.0 5.2 100.0 Lab % 67.4 29.9 2.7 100.0 Other % 50.1 41.7 8.1 100.0
Null Hypothesis: There is no relation between media and voting.
Table 4
Chi Square 374.569 Significance 0.0000 Degrees of freedom 4 Gamma -0.451
Here the Chi Square fulfils the critical condition and so the null hypothesis can be rejected with a high level of confidence. The Gamma rating is very high and shows that there is a strong relationship between the paper an individual reads and the way that they vote. Around 45% of the way people vote can be explained by what newspaper they read in terms of political bias. This leads to a high level of confidence when generalising to the wider population.
Hypothesis 3: People who live in the South are more likely to vote Conservative. People who live in the North are more likely to vote Labour.
Table 5.
Region / Vote Conservative Labour Other Total North % 36.3 46.9 16.8 100.0 Midlands % 54.8 30.3 14.9 100.0 South % 53.6 24.9 21.5 100.0 Wales % 33.6 50.0 16.4 100.0 Scotland % 26.6 38.0 35.5 100.0
Null Hypothesis: There is no relationship between vote and the region someone lives in.
Table 6.
Chi Square 243.313 Significance 0.0000 Degrees of freedom 8 Gamma 0.177
Here the Chi square fulfils the critical value again. This means that the null hypothesis can be confidently rejected. The Gamma rating is lower than some previous scores but still remains significant, it shows that around 18% of the amount of error is reduced in voting patterns when it is cross tabulated with region.
Hypothesis 4: The higher the individuals income, the more likely they will vote Conservative. The lower an individuals income, the more likely they will vote Labour.
Table 7.
Income / Vote Conservative Labour Other Sum <£3,999 26.5 51.7 21.8 100.0 £4 - £7,999 29.2 50.9 19.9 100.0 £8 - £11,999 33.9 43.3 22.8 100.0 £12 - £17,999 39.0 34.8 26.2 100.0 £18 - £22,999 48.8 24.2 27.0 100.0 £23 - £28,999 48.9 26.7 24.4 100.0 £29 - £34,999 60.1 12.0 27.8 100.0 £35,000> 64.5 16.1 19.4 100.0
Null Hypothesis: There is no relationship between income and vote.
Table 8.
Chi Square 228.805 Significance 0.000 Degrees of freedom 14 Gamma -0.162
Here the Chi Square reaches its critical value and so the null hypothesis can be rejected with a high level of confidence; and can be confidently generalised onto the wider population. The Gamma coefficient shows that there is a negatitive correlation; 16.2% of the variance can be explained by income.
Multivariate analysis.
Table 9.
Vote is the dependent variable.
Variable / Stat B Beta T Sig.T Media -0.2703 -0.2090 -7.7298 0.0000 Income -0.0563 -0.1572 -5.7251 0.0000 Region -0.0713 -0.1368 5.2193 0.0000 Age -0.0521 -0.1118 -4.2022 0.0000
Multiple R 0.12611 F-value 50.47 Adjusted R 0.12362 F-sign 0.0000
Constant = 2.472
Valid Cases= 1404
The analysis of the four independent variables on the dependent variable shows that it is a reasonably good model in explaining voting behaviour. Although the multiple and adjusted R variables show that there is still much to be explained (88%). All four of the variables have a significant effect on voting behaviour, each T value is high and the significances of T and F show that there is almost no chance of the relationships being due to random variation. The B and Beta coefficients show that each variable alters the model of voting behaviour.
Discussion.
This model shows that indicators other than class can be used to determine how an individual will vote. Altogether, the hypothesis have been tested as correct, age, media, area lived in and income all affect the way an individual will vote. An individual who is 'old', reads a right wing paper, lives in the South or Midlands and is relatively affluent is, according to this model, very likely to vote Conservative. Similarly, an individual who is 'young', reads a left wing paper, lives in the North and is relatively poor is most likely to vote Labour.
Hypothesis 1: is shown to be correct. Table 10 (below) shows the comparative change between the two parties as age increases. The Conservative party rises with only a slight fall in the 55-64 year old age group; Labours vote falls but begins to rise again in the 55-64 as well falling off slightly in the top age group. what is interesting here is that Labour and Conservative vote is very similar in the 18-24 age group, which makes the distinction that it is harder to predict a young persons beliefs than an older persons.
Table 10.
Labours' vote does begin to pick up over the last two groups, this may be due to some older people beginning to believe that the Government should provide for them better and that Labour is best for them, or it is due to a high level of partisan support in the older groups which is now dying out.
Hypothesis 2: This was again shown to be correct. Those who read a right wing paper are more likely to vote Conservative; those who read a left wing paper are more likely to vote Labour. The two figures of most interest from table 3 are those who vote Labour and read a left wing paper, and those who vote right wing and read a right wing paper (figures in bold). This shows a very high correlation between the two, 79% of those who voted Conservative also read a right wing paper, 67.4% of those who voted Labour read a left wing paper. What is also interesting is those who voted for 'other' parties did not greatly favour one kind of paper; and those who read an independent
paper do not overwhelmingly support a particular party. Which way this relationship goes (i.e. media influences vote or media reflects peoples beliefs) is impossible to tell.
Hypothesis 3: Is shown to be correct. Table 5 shows that there is a difference in voting patterns between the North and the South. In the North, Labour have a majority of 10.3% over the Conservatives; in the South, the Conservatives have a 28.7% lead over Labour. In the Midlands, the Conservatives also have a high lead over Labour (24.5%). This shows that most of the concentration for support for Labour is in the North, whereas the Conservatives dominate the South and Midlands.
Hypothesis 4: Is shown to be correct.
Table 11.
As Table 11 shows, Those on a higher income are more likely to vote Conservative whilst those on a lower income are more likely to vote Labour. As already discussed, the Chi Square is high enough to allow the theory to be generalised onto the wider population.
Multivariate Analysis.
This shows that the four hypotheses when put together can go some way in explaining left and right wing support. All of the four variables have an effect on voting behaviour in the way discussed above.
Conclusion.
This research note was an investigation of how an individual votes, given a number of personal social and economic attributes. The four attributes examined were age, income, newspaper read and area of the country they come from. The results show that a great deal can be learnt from just these four characteristics and when put together they give a good indicator of an individuals voting behaviour. the four variables were cross tabulated with voting and the results printed in this research note. A little amount of analysis of the data together with some tentative conclusions have been put forward.
There are a number of shortfalls in this paper. Firstly, I would have liked to have had more time to examine more variables such as race, gender and class to see if they have an effect. I would have prefered to have analysied the datat better and brought about more in depth discussion of the material. I would have liked to have examined the theory that people now vote on a more individualistic basis (see Theory section) however, this requires time series data and a great deal more time.