D: drier
The convectron gauge on the vacuum line was checked before the experiment began to ensure the reading was zero. A shaped PTFE cylinder was pushed with slight force into a glass socket to seal the vacuum taps at an area of approximately 1mm in width. The sample tube was then isolated as tap T1 was closed and cooled as the tube was immersed in liquid nitrogen. The sample tube was left for 20 minutes until thermal equilibrium was reached. The dosing section was then isolated as tap T4 was closed and nitrogen was admitted to fill the section between T1 and T4. The gas pressure was subsequently measured on the capsule gauge. Tap T3 was opened until 500mbar was reached on the gauge then tap T3 was closed. The pressure reading on the capsule gauge, P1, and the room temperature were recorded. Tap T2 was then closed and T1 opened. The equilibrium pressure reading on the convectron gauge, p1, was recorded. The next dose was introduced when T1 was closed and T2 opened. The pressure on the capsule gauge, P2 was recorded. Tap T2 was subsequently closed and T1 opened allowing dose two to enter the sample tube. The equilibrium pressure on the convectron gauge, p2, was recorded. The procedure was followed in this manner until several results had been recorded and the equilibrium pressure exceeded 200mbar.
The raw data table below represents the results obtained from the gauges within the experiment:
Results:
The experiment required the measurements to be expressed as a volume under standard ambient temperature and pressure. I therefore converted the data as shown below using the ideal gas equation:
V = nRT/P
Where: Vd = (P2V2T1)/(P1T2)
P2= pressure reading / bar
V2 = 0.00044m3
T1 = 298K
P1 = 1 bar
T2 = 298.5K
Then calculations had to be made to work out the volume adsorbed per dose and subsequently correct the ‘dose volume’ (Vd) by subtracting the amount of gas left in the ‘dead space’ (Vds). A further correction was made to the subsequent doses as shown in the general equation further down which was known as the ‘recycled volume’ (Vr).
There is an Excel spreadsheet attached to show my workings.
A table to show my calculated volumes:
From these known volumes the volume adsorbed could be calculated using the following equations:
V(1) = Vd(1) – Vds(1)
This represents the first dose minus the dead space to give the first amount adsorbed on the sample.
For the amount of substance adsorbed, V(2), the equation is expressed as:
V(2) = [Vd(1) + Vd(2)] – Vds(2) – Vr(2)
This is the sum of dose one and two minus the remaining gas in the dead space and the recycled volume of dose two.
The general equation is shown below and was followed to determine the volumes adsorbed:
V(n) = [Vd(1) + Vd(2)+Vd(3)+Vd(n)] – Vds(n) – [Vr(2)+Vr(3)+Vr(n)].
The results calculated are shown below:
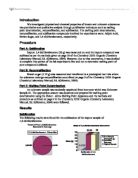
This data recorded was then used to plot the adsorption isotherm known as the quantity of gas adsorbed vs. the relative equilibrium pressure. To determine the value of z the equation p/p0 was used. The value of p was the equilibrium pressure recorded and the value of p0 was the saturated vapour pressure of the liquefied nitrogen. This was 1atm that is equal to 101325mbar. This can be converted to 1.01325bar. The data plotted is given below:
This gave the following graph:
This is representative of an isotherm due to the slight curve shape within the graph. However, the monolayer point is not evident from this isotherm as there is no clear plateau indicating completion of the first monolayer. This could be due to the fact that the molecules are forming multilayers where some are adsorbed on already adsorbed molecules. The molecules of gas are in constant random motion causing an expanding effect. The pressure build up is a result of the molecules colliding with the walls of the container. It is clear that the volume adsorbed increases as the value of p/p0 increases. As the gauge pressure decreases the atmospheric pressure increases causing the force exerted on the surface to become greater and subsequently the volume to increase. The shape of this graph conforms to the theory that the adsorption of the second and subsequent layers follow without any discontinuity with regards to the first layer that generally has a high equilibrium pressure for completion. It is known that as the equilibrium pressure approaches p0, the quantity adsorbed increases without limit.
The saturated vapour pressure of nitrogen at ‘liquid nitrogen temperature’ is 1 atmospheric pressure. It can be converted to 101325 Pascals or 1.01325bar.
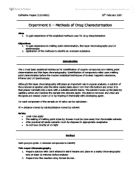
A second graph was plotted using the following data that is representative of the BET equation:
This was to plot the isotherm using the BET model using the form:
[z/ V(1-z)] vs. z
The values plotted gave the equation: y = 3236.5+1667.2. The values of the slope and the intercept allow the value of Vm to be determined. This is the amount of gas adsorbed corresponding to a monolayer.
From the BET equation below the value of Vm can be calculated:
Y = m (slope) x + c (intercept)
z/V(1-z) = [(c-1)/Vmc] z + 1/Vm c
Vm = 1/ m + c
Vm = 1/ ( 3236.5+1667.2)
Vm = 2.039 x 10⁻⁴ m3
Now this value has been determined; the value for the constant, c, can be calculated using the following equation:
Slope value = 1/(Vm x c)
C = 1 / (Vm x slope value)
C = 1/ (2.039 x 10⁻⁴m3 x 1667.2)
C= 2.94
This subsequently allows the heat of adsorption of nitrogen to be estimated using the following equation:
c≈exp[-q1-qL/RT]
where:
q1: the heat adsorption from the first layer
qL: the heat of liquefaction of the gas = 5590KJ mol-1
T: 77.4K
R: 8.314 JK-1 mol-1
C: parameter = 2.94
This equation above can be rearranged to give:
q1 = -(RT) x ln C + qL
q1 = -(8.314 JK-1mol-1x298K) x (ln 2.94) + 5590 KJmol-1
q1 = 4.896Kjmol-1
The heat of adsorption of nitrogen in the first adsorbed layer is calculated to be 4.896KJ mol-1.
Finally the specific surface area of silica was estimated using the equation:
A = Nσ
Where: N = number of moles of nitrogen
σ= the area one molecule occupies
The area is calculated using the ideal gas equation:
n = PV/ RT
n= (1atm x 2.039x10-4mol)/(8.314JK-1mol-1 x 298K)
n = 4.96 x 10¹⁶ mol
OR
n = (101.325Kpa x 0.2039L)/(8.314JK-1mol-1 x 298K)
n = 8.34 x 10⁻³ mol
This can be multiplied to the Avogadro constant, L = 6.02 x 10²³ mol-1
(8.34 x 10⁻³ mol) x (6.02 x 10²³ mol-1)
no. of molecules of nitrogen = 5.02 x 10²¹
Mass sample: 1.14g
Each nitrogen molecule occupies 16.2 x 10⁻²⁰ m2 of surface
Subsequently:
A = (No. of moles x surface space of each N2 molecule)/mass
A = (5.02 x 1021 mol x 16.2 x 10-20 m2)/ 1.14g
A = 713.4 m2 g-1
The value calculated is very respectable in relation to the literature value I obtained to be 800m2g-1. This could be due to the experiment working efficiently and the results obtained were in accordance with the theory of the adsorption isotherm and the relationship between volume adsorbed and equilibrium pressure. However, even though I believe the isotherm conforms to the BET model, I do believe that anomalies were present. When the pressure reached 0.13bar, there was a decrease in the value of z/V(1-z). This caused a dip in the results plotted and could have been due to error within the experiment such as accurate pressure readings or it could have been due to the experimental set up and the atmospheric pressure rising as the pressure reading decreased. It may have been the natural progression in the experiment and due to the expansion of the gas.