Scientific Knowledge
Electricity flows due to electron flow. Electrons in a conductive material are free to move and therefore cause the material to conduct electricity i.e. the “sea” of electrons in metals.
“Electricity” can be reported in voltage or current. The voltage is measured in Volts (V) and the current is measured in Amperes (Amps). Current is an electrical power flowing in one direction. Voltage is an electrical force. Resistance is the rate at which current is impeded and converted into heat; it is measured in Ohm’s (Ω). Since we will be plotting I-V graphs it would be simple to exhapolate the gradient and obtain values of resistance.
In order to apply Ohm’s law we need to know two of the 3 variables. In this experiment we will know the voltage and current. Therefore by rearranging Ohm’s law we can calculate the resistance.
- A steady increase in resistance, in a circuit with constant voltage, produces a progressively (not a straight-line if graphed) weaker current.
- A steady increase in voltage, in a circuit with constant resistance, produces a constant linear rise in current.
In this case, Ohm’s law is needed to calculate the resistance of the fixed resistor and the change in resistance as the filament lamp gets hot. For each case gradient from the appropriate graphs will be used. Resistance can be varied by using a variable resistor, by altering the gauge or by length of the wire or by changing the temperature. If a longer wire is being used then the resistance increases as the electrons have to travel further than in a short wire. If a thicker wire is being used then the electrons have more space to move and therefore resistance is decreased. If a thinner wire is used then the resistance will increase as the electrons cannot get around the circuit easily.
Method
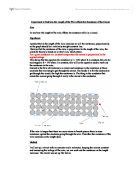
The work surface was insured to be dry and clean. Bags, stools and other possible obstacles were removed from the work area. The equipment was collected according to the list given and verified by close inspection to be clean, non-corroded and undamaged. The equipment was connected according to figure 4. But was not turned on turned on until connections were checked to be correct and safe and settings on power supply and meters were appropriate (lowest for each). Writing equipment was in place before the experiment was started.
The equipment was turned on. As the voltage on the PSU was increased it was confirmed on the voltmeter and the reading on the ammeter was quoted. For the first circuit a total of 7 ammeter readings were taken and repeated and averaged. Each time the voltage was increased by 2 V.
The averaged value for each voltage was recorded in the table. Once the highest voltage had been reached for the PSU the circuit was switched off and the fixed resistor was replaced with a filament lamp (figure 6). The PSU was set to zero volts and the circuit was turned back on after making sure that the filament lamp was in tact. The voltage readings were then repeated as before and were inserted in another table and averaged out. Following this the equipment was cleared away after making sure that hands were dry. The tables were then plotted onto graphs.
Method in summary:
- Apply safety precautions.
- Gather equipment and connect it according to figure 4.
- Recheck for safety and turn the circuit on.
- Increase the Voltage by 2V every reading and note the current reading on the ammeter.
- Once 12V is reached switch the PSU off.
- Replace resistor with a Filament Lamp
- Carry out steps 3-5 again.
- Once readings for filament lamp and fixed resistor are tabulated clear up equipment.
- Plot an I-V graph for the fixed resistor and Filament Lamp.
Variables
The controlled variable in this experiment is the Equipment used
The input variable in this experiment is the voltage.
The output variables of this experiment are the current and resistance.
Tables of results
Analysis of Results
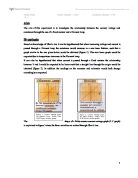
Both graphs produced results that should be expected by the types of resistor used. The graph for the fixed resistor is a straight line through the origin. This suggests that V and I have a linear relationship and obey the straight line equation y= mx + c, since the majority of the values lay close to the line of best fit. The slope of the line was unchanged i.e. no tapering off, it confirms that a fixed resistor was used since the slope according to ohms law is the resistance. The current value for 4.1V is more than was than expected, it may be classed as an anomaly but does not affect the line of best fit too much. The reason for this value may be down to poorly calibrated equipment or incorrect reading from the ammeter i.e. human error. The remainder of the current readings fit the expected trend as said earlier, and for a constant resistance V is related to I. Such that when V increases I increases too. This confirms the hypotheses for the fixed resistor which was:
- When current is passed through a fixed resistor the relationship between V and I would be expected to be linear such that a straight line through the origin should be obtained.
The graph for the filament lamp shows a non linear relationship between V and I. the curve of best fit suggests that resistance increases with increasing voltage and current. This is confirmed by the resistance calculations from the three gradients taken from the indicated tangents (Table 4). The gradient calculated at each of the three points was different and the resulting resistance value was also increased. This occurs due to an increase in temperature of the filament lamp. This also confirms my hypotheses as being correct.
- When current is passed through a filament lamp the resistance would increase in a non-linear fashion.
- This non-linear graph would be expected due to temperature increasing and its relative effect on resistance.
Results for both resistors were as expected based on previous scientific knowledge on Ohm’s law and how resistance is affected by V, I and temperature. All parts of the hypotheses were confirmed to be correct and supported by the results we obtained.
Conclusion
Looking at the graphs and the table of results it is clear that the hypotheses stated in the beginning of the experiment are correct:
- When current is passed through a fixed resistor the relationship between V and I would be expected to be linear such that a straight line through the origin should be obtained.
- When current is passed through a filament lamp the resistance would increase in a non-linear fashion. This non-linear graph would be expected due to temperature increasing and its relative effect on resistance.”
Due to the curve and straight line graphs it can be concluded that, as Ohm’s law suggests, there is a relationship between the resistance, current and voltage. When V increases I increases too, as long as resistance stays constant (for fixed resistor) or increases (for filament lamp). Also as the temperature increases the resistance increases, as observed with the filament lamp.
Evaluation
The experiment was successful in its aims. Namely that there was a relationship between V, I and R as stated by ohms law. The experiment was also successful since there were few anomalies, only one for the fixed resistor. Thus it can be assumed that the results obtained were accurate given the sensitivity of our equipment. We tried to resolve these anomalies by doing these tests again, however this resulted in getting the same figure. We may assume that the equipment isn’t to blame since it was kept the same throughout the experiment. The experiment was conducted in a safe environment and all precautions taken before the experiment paid off in that no accidents happened.
It would have been practical in the interest of conducting a fair test to use averages for series of current readings. This could be done using two different sets of equipment, conducting the experiment on each set and averaging the values. This could help us reduce error margin in any anomalies found. It may have been interesting to investigate the same aim with a wider range and more sensitive set of equipment. Smaller graduations of voltage on the PSU would have allowed us to plot the graphs with more accuracy. If possible it would have been interesting to use a diode. However given the amount of time we had, it would not have been possible to further complicate the experimental design.
We may also have adjusted variables such as the gauge, length and type of wire used to investigate the effect these factors have on ohms law. It may also have been of interest to us if we investigated how adjusting the circuit diagram would have affected our results. However this may have been a little advanced for our level at present.
Bibliography
GCSE double Science Physics – CGP – ISBN: 1-84146-401-5
New Modular Science for GCSE, (Vol 1), - Heinemann (1996) – ISBN: 0-43557-196-6
AQA GCSE Science syllabus (2001).