Data Handling Project
By Peter Noonan
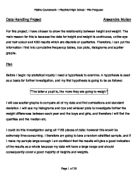
With this project I'm going to try and show that in year 7, girls are in general taller but the males are heavier in weight. By year 11 the boys are taller and heavier. I'm going to try to prove with the information I have been given that although girls tend to grow sooner and faster then boys they stop growing and slow down while boys continue to grow, on average to a taller height and males are heavier across the board no matter if they are taller or not.
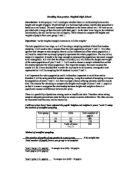
To do this I will collect different information on the height and weight of girls and boys in year seven and eleven then I will compare results.
I will collect the following results in 40 males and females from year 7 and year 11:
* Cumulative frequency graphs to show the cumulative totals of 40 people and also to let me find the interquartile ranges
* Box and Whisker Diagrams showing the interquatertile ranges
* Scatter graphs with lines of best fit to show the trend
* Unequal histograms showing how many people are in the different ranges and whether the boys in year 11 have more people in the heavier columns of example
* Finding the standard deviation to find out which is the more reliable data
I chose this data to collect because its seems to be very suitable for my investigation and shows my maths ability well. I can find this information through the information I have been given and using a formula on excel I looked up I'm able to take 40 completely random people from the list I was given, of just male and females. I know that it is random because the formula uses Excel's random number feature. There is no way to create a completely fair sample, apart from taking everyone, and this is not suitable due to the quantity, so by making it random I hope to get a even spread between the tall and small, fat and thin. Through doing this I will hope to compare the height and weight of the boys and girls in year 7 and 11. I will study the Year 7 data first and then move on to the Year 11 data.
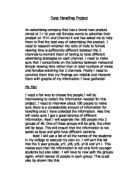
Year 7
Scatter Graphs
I'm drawing scatter graphs to find out the average weight for a given height so I can find out whether at 1.50 meters tall the males or females are heavier for example.
What we can tell from these graphs? (On prev. page)
We can tell from the graph that the girls have a better correlation and there is a smaller gap between the tallest and smallest, which points to the girls all being more similar where as the boys are more varied. In both graphs most of people are in the 1.4m to 1.6m range with most of the girls clustered nearer the 1.6m line and the boys more spread out, this could mean that on average girls are taller but since there are more boys that are taller this may not be so and these taller boys will bring the total boy mean height up. For weight nearly all the girls are in the 40kg to 60kg range and in general closer to the 40kg line. But the boys are a lot more spread out and are both above and below the 60kg mark line
By Peter Noonan
With this project I'm going to try and show that in year 7, girls are in general taller but the males are heavier in weight. By year 11 the boys are taller and heavier. I'm going to try to prove with the information I have been given that although girls tend to grow sooner and faster then boys they stop growing and slow down while boys continue to grow, on average to a taller height and males are heavier across the board no matter if they are taller or not.
To do this I will collect different information on the height and weight of girls and boys in year seven and eleven then I will compare results.
I will collect the following results in 40 males and females from year 7 and year 11:
* Cumulative frequency graphs to show the cumulative totals of 40 people and also to let me find the interquartile ranges
* Box and Whisker Diagrams showing the interquatertile ranges
* Scatter graphs with lines of best fit to show the trend
* Unequal histograms showing how many people are in the different ranges and whether the boys in year 11 have more people in the heavier columns of example
* Finding the standard deviation to find out which is the more reliable data
I chose this data to collect because its seems to be very suitable for my investigation and shows my maths ability well. I can find this information through the information I have been given and using a formula on excel I looked up I'm able to take 40 completely random people from the list I was given, of just male and females. I know that it is random because the formula uses Excel's random number feature. There is no way to create a completely fair sample, apart from taking everyone, and this is not suitable due to the quantity, so by making it random I hope to get a even spread between the tall and small, fat and thin. Through doing this I will hope to compare the height and weight of the boys and girls in year 7 and 11. I will study the Year 7 data first and then move on to the Year 11 data.
Year 7
Scatter Graphs
I'm drawing scatter graphs to find out the average weight for a given height so I can find out whether at 1.50 meters tall the males or females are heavier for example.
What we can tell from these graphs? (On prev. page)
We can tell from the graph that the girls have a better correlation and there is a smaller gap between the tallest and smallest, which points to the girls all being more similar where as the boys are more varied. In both graphs most of people are in the 1.4m to 1.6m range with most of the girls clustered nearer the 1.6m line and the boys more spread out, this could mean that on average girls are taller but since there are more boys that are taller this may not be so and these taller boys will bring the total boy mean height up. For weight nearly all the girls are in the 40kg to 60kg range and in general closer to the 40kg line. But the boys are a lot more spread out and are both above and below the 60kg mark line