Maths Coursework-relationship between heights and weights of 50 girls in year 11
HYPOTHESIS:
I think that as the height of the girls increases the weight will as well, so I expect my graph to have a slight positive correlation.
METHOD:
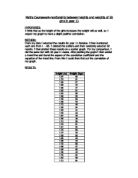
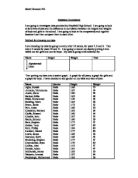
From my data I selected the results for year 11 females. I then numbered each one from 1 – 86. I deleted the outliers and then randomly selected 50 results. I then plotted these results on a scatter graph. For my comparison, I did the same but with 50 year11 males. After plotting the graph I then added a trend line and found the square of the correlation coefficient and the equation of the trend line. From this I could then find out the correlation of my graph.