I have chosen the data I am going to be using by having all 300 students data on the computer in front of me listed 1-300, then I got my calculator and pressed SHIFT followed by RAN then times it by a random number. This brought up and random number between 1-300. The number that came up, I then selected that student from the data in front of me. By doing this the investigation will be fair as it is a random sample taken from the data, whereas if I just took the first 30 out then it would not be a fair investigation.
For the hypotheses I am going to use averages and a graph in order to see whether my statement is correct, by using averages I can see whether the height of someone, has anything to do with the height of them aswell. By using a graph I can spot odd results and see whether there is a pattern in the graph which is what I am looking for. The reason I have chosen these two methods is because I feel that they are best for the investigation I am doing.
Modal weight for year 7 boys (kg) =
Modal height for year 7 boys (m) =
Modal weight for year 7 girls (kg) =
Modal height for year 7 girls (m) =
Mean weight for year 7 boys (kg) = 45.7
Mean height for year 7 boys (m) = 1.55
Mean weight for year 7 girls (kg) = 43.06
Mean height for year 7 girls (m) = 1.47
Median weight for year 7 boys (kg) = 43
Median height for year 7 boys (m) = 1.565
Median weight for year 7 girls (kg) = 43.5
Median height for year 7 girls (m) = 1.545
Range weight for year 7 boys (kg) = 64
Range height for year 7 boys (m) = 1.71
Range weight for year 7 girls (kg) = 62
Range height for year 7 girls (m) = 1.75
All three measures of average ( mean, median and mode) are greater for boys than for girls. The range of weight for year 7 boys is slightly higher than year 7 girls, although year 7 girls range for height is slightly higher than the boys. In conclusion, although there are a small number of boys with smaller weights, and girls with bigger weights, the evidence suggests that, in general, the weight for the boys is greater than the weight for the girls.
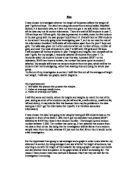
My graphs showing frequency shows that the majority of the girls weight is between 1.50m-1.60m. It shows the majority of their weight is between 40-50kg.
On the other frequency graph showing the boys height and weigh , hows that the majority of boys height is between 1.40-1.60m and the majority of their weights is between 40-45kg.
I feel this graph is useful as it shows the majority of the boys and girls height and weight, for example-
This shows that these boys heights are between 1.40-1.60m ( majority height ) and the weight is between 40-45kg ( majority weight ).
This shows that these girls heights are between 1.50-1.60m ( majority height ) and the weight is between 40-50kg ( majority weight ).
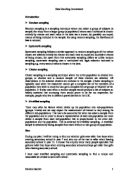
I don’t feel that any of these tables show what I am looking for or proves my hypothesis to be correct, which leads me to believe that it is incorrect.
From looking at this table, going in height order, comparing it to the weight coloumn next to the height column, I cannot see any relation to the size of the person and the weight of them, apart from some odd results in there, but for the majority my hypothesis is not true.
How ever, looking at the male column, I can see that the weight does go up with the height, although there is nothing to show that however tall you are, you will be this weight.
Investigating this hypothesis has shown that for the girls weight and height, I could not see anything that proved my hypothesis. By putting the height and weight in ascending order and comparing them next to each other, I should of seen as the height of the girls went up, so did the weight. I did not see this which leads me to believe that my hypothesis was incorrect.
However, looking at the boys table, when I sorted the height and weight into descending order, I found that the boys weight, did go up as the height of the boy did. This didn’t really prove my hypothesis as there isn’t a exact way to say that if a boy is e.g 1.60m that his weight would be 50kg.
Possible limitations of this investigation include, the area that the data was taken from, for example certain parts of the country weigh more than the rest and some parts of the country has taller people etc. Also I may of picked bad data to investigate from, even though the data that was picked out was random.
I think my finding applies to the whole population, as you can’t tell some ones height by their weight or vice versa. You get tall and fat people, small and fat, small and skinny and small and fat, and you get normal weight tall people and normal weight small people and so on…
This investigation could be improved by using a bigger range of data, for example instead of only relying on a sample of 30 people, you could make it into 500. To improve my findings I could of used other diagrams like frequency polygons, stem and leaf diagram or a histogram. I did not feel that it was necessary to use them this time. This would have been more effective if I did as it would make me more confident with my decision and may of made me think otherwise.