The box and whisker diagrams can be found in Appendix B.
Outliers
I was able to decide whether or not to accept or reject an outlier by looking at the Body Mass Index which considers both the height and weight. This told me whether or not the outlier was ‘normal’. In order to be ‘normal’ the Body Mass Index had to lie between 15 and 25. The Body Mass Index is found by:
Weight (kg)
Height² (m)
Height
Females
Yr 7:
Yr 8:
- 135cm – I have decided to reject this outlier as she has a B.M.I. of 28.
Yr 9:
- 180cm – I have decided to accept this outlier as she has a B.M.I. of 19.
Yr 10:
Yr 11:
- 103cm – I have decided to reject this outlier as she has a B.M.I. of 42.
- 137cm – I have decided to accept this outlier as she has a B.M.I. of 16.
Males
Yr 7:
Yr 8:
- 120cm – I have decided to accept this outlier as he has a B.M.I. of 26.
Yr 9:
- 147cm – I have decided to accept this outlier as he has a B.M.I. of 19.
- 180cm – I have decided to accept this outlier as he has a B.M.I. of 15.
- 180cm – I have decided to reject this outlier as he has a B.M.I. of 13.
Yr 10:
Yr 11:
Weight
Females
Yr 7:
- 57kg – I have decided to accept this outlier as she has a B.M.I. of 22.
Yr 8:
Yr 9:
Yr 10:
Yr 11:
Males
Yr 7:
- 32kg – I have decided to reject this outlier as he has a B.M.I. of 13.
- 33kg – I have decided to accept this outlier as he has a B.M.I. of 16.
- 53kg – I have decided to accept this outlier as he has a B.M.I. of 22.
- 54kg – I have decided to accept this outlier as he has a B.M.I. of 23.
- 56kg – I have decided to accept this outlier as he has a B.M.I. of 25.
- 59kg – I have decided to accept this outlier as he has a B.M.I. of 26.
- 75kg – I have decided to accept this outlier as he has a B.M.I. of 25.
Yr 8:
- 5kg – I have decided to reject this outlier as he has a B.M.I. of 2.
- 57kg – I have decided to accept this outlier as he has a B.M.I. of 19.
- 59kg – I have decided to accept this outlier as he has a B.M.I. of 20.
- 60kg – I have decided to accept this outlier as he has a B.M.I. of 23.
- 74kg – I have decided to reject this outlier as he has a B.M.I. of 29.
- 80kg – I have decided to accept this outlier as he has a B.M.I. of 26.
Yr 9:
- 75kg – I have decided to accept this outlier as he has a B.M.I. of 24.
Yr 10:
- 9kg – I have decided to reject this outlier as he has a B.M.I. of 4.
- 70kg – I have decided to accept this outlier as he has a B.M.I. of 20.
- 72kg – I have decided to reject this outlier as he has a B.M.I. of 30.
- 80kg – I have decided to accept this outlier as he has a B.M.I. of 26.
- 80kg – I have decided to accept this outlier as he has a B.M.I. of 26.
Yr 11:
Analysis of Box and Whisker Plots
Height
By looking at the medians for the girls’ heights, I can see that it increases as they move up the school. This finding proves the hypotheses that the height of females will increase from Year 7 to 11. However, the diagrams showed that this trend was not followed by the interquartile range or the range. This may be due to the outliers pulling the box plot out of proportion.
The medians for the boys’ height box and whisker plots also showed the general trend that the boys get taller as they move up through the school. However, the median for Year 9 was anomalous in that it didn’t follow this trend. This was probably distorted because of the outliers. Nevertheless, I feel that the hypotheses stating that the height of males will increase from Year 7 to 11.
Weight
The weights of the girls did not seem to follow a pattern. By looking at the median I can see that there was an increase in weight from Years 7 to 8 but from Years 9 to 11 this fell and then remained constant. This could be due to the girls becoming more conscious and starting to diet as this was not the pattern that was expected. This information proves the hypotheses, the weight of the females will increase from Year 7 to 11, wrong.
By looking at the medians I can see that the boys’ weights followed a pattern of increase up to Year 10 but in Year 11 their weights decreased. However, I feel that this was an anomalous and should therefore be disregarded. This may have been caused due to the boys exercising more or eating healthier. I feel that this data proves the hypothese that the weight of males will increase from Year 7 to 11.
Further Sampling
From now on I have decided to only concentrate on Years 7, 9 and 11 but in more detail. The general trend can still be seen from looking at these 3 year groups as I have the two extremes and the middle year group. Years 8 and 10 will not offer much more information that will differ.
Histograms
I have drawn a histogram for each set of data in order to see how the data is spread across each year group and also to see any tends or patterns. I also want to see if the histograms follow symmetrical distribution therefore showing that growth is normal. If this is the case then:
Mean = Mode = Median
A histogram showing normal distribution will be symmetrical and ‘bell-shaped’ which indicates that the majority of the data is gathered around the mean and then disperse evenly on either side of the mean.
The histograms can be found in Appendix C.
Analysis of Histograms
The histograms both agree and disagree with the hypotheses stating that the distribution of each male and female height/weight in each year group is symmetrical and normal. Although the histograms are not symmetrical, they show the correct spread by which the majority of the data is congregated in the middle with the mean but then spreads out. Therefore, I feel that even though the histograms are not symmetrical, they do show even distribution and so I can conclude that the distribution is normal.
All of my histograms are bell shaped but are not entirely symmetrical. This implies a ‘nearly’ normal distribution in which the majority of pupils are concentrated towards the mean but disperse evenly to outer extremes. In order to analyse this in more detail I will now continue to examine the data through use of standard deviation which will measure this spread from the mean.
Standard Deviation and Mean
I have used standard deviation because it can be used to show how far the data is spread from the mean. Unlike the interquartile range, standard deviation uses all of the data rather than just the middle 50%.
I then drew the mean and standard deviation on diagrams so that any patterns or trends in the data were clearly visible.
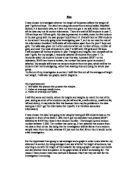
The table below shows the mean and standard deviation for each set of data.
The mean and standard deviation diagrams can be found in Appendix D.
Analysis of Standard Deviation and Mean
Height
The boys’ height showed a definite pattern and the line increased steadily at the same rate. This told me that the boys were growing steadily in height between Years 7 and 11, yet again proving the hypotheses that the male heights increase from Years 7 to 11. This also shows that the boys continue to grow throughout this time.
The girls’ heights were not as conclusive. At first there was an increase but between Years 9 and 11, this decreased therefore the data did not produce a straight line. This suggests that the girls tend to not grow as much as previously as they grow older. This supports the hypotheses that females tend to grow earlier then males as whereas the girls seem to decline or stop growing, the boys continue to grow.
Weight
The male weights showed an increase over the course of the three years. This increase was more dramatic between Years 9 and 11. This information yet again underlines the fact that male weights increase from Years 7 to 11.
The female weights increased between Year 7 and 9 but then between Years 9 and 11 the weight remains constant. This suggests that either the girls had stopped growing and putting on weight or that they were dieting in order to stop putting on weight. This data cannot therefore partly prove the hypotheses that females tend to grow earlier then males as the girls tend to stop putting on weight before the boys.
Body Mass Index
So far I have looked at height and weight separately. I am now going to look at the Body Mass Index which considers both height and weight together. In order to analyse this data, I have drawn box and whisker plots.
The B.M.I. box and whisker plots can be found in Appendix E.
Analysis of B.M.I. Box and Whisker Plots
The box and whisker diagrams show a decrease in the Body Mass Index of girls between Years 11. This is indicated by the decline in size of the interquartile range and also by the reduction in the medians. This therefore disproves the hypothesises that female height and weight increase between Years 7 and 11. As the Body Mass Index calculates the ratio between the height and weight this suggests that any previous patterns of either the height or weight increasing were out of proportion.
The box and whisker diagrams for males show a increase in the medians which suggests that the boys were growing in both height and weight over the Years 7 to 11. This reinforces the hypothesises further that the height and weight of the children increase over Years 7 to 11.
Looking at both sets of diagrams, it is possible to see that none of the medians have exceeded a Body Mass Index of 20. As the average Body Mass Index of an adult is between 20 and 25, this suggests that the pupils are still growing and have not yet reached their peak. They can still be considered children because their Body Mass Index lies between 15 and 25.
Conclusion
From looking at my overall investigation, I can draw a number of conclusions.
Firstly, it is possible to see that male height and weight increases from Years 7 to 11 thus proving the hypotheses. This is also evident when looking at the Body Mass Index.
When looking at the girls, it is much harder to see such obvious patterns. Therefore I found it hard to prove the hypotheses that female weight and height increased over time. Both height and weight seemed to decrease in some places or stay constant. This could be due to dieting or a healthier eating regime. When looking at the Body Mass Index, I found a decrease which suggests that females are not gaining in weight or height and if they are they only gain in one or the other, therefore keeping the ratio low.
All of the histograms followed a ‘nearly’ normal distribution curve suggesting that the school population was evenly distributed in terms of height and weight. Although not symmetrical, this pattern was clear.
Finally, by looking at the means and standard deviation I was able to come to the conclusion that girls tend to grow earlier than boys, as stated in the hypotheses. I found this as girls tend to reach a set height or weight before either decreasing or remaining constant whereas the boys continued to grow. This suggests that girls finish growing earlier then boys.