Resistance in the wires will be based on four factors;
Length
Cross-sectional area
Temperature
Material.
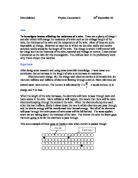
Here is a diagram that explains why this is.
The drawing is of a wire. The black dots are the atoms inside the wire. The line passing through the wire is the path of the electron(s) that must flow through.
If the wire had a smaller cross-sectional area, the electron would have less space to pass through. The electron flow has a higher chance of finding a path through the atoms if the wire is wider, and a smaller chance if the wire is thinner.
If the wire was heated, the atoms would vibrate, thus increasing the chance of collision with the electron, which would cause it to lose energy, as some of its energy is turned into heat energy and kinetic energy at the moment of collision. An electric heating element has a high resistance, so there will be more collisions to create more heat energy.
The length of the wire also affects the resistance of it. If the wire is longer, there is obviously more chance of collisions occurring, so more energy is lost.
The material the wires are made out of will also affect their resistance. Some materials have more resistivity than others. I will find out which of the materials the wires are made out of are more or less resistive when I do the experiment.
I will do some calculations to work out the theoretical resistance of lengths of all the different wires.
Without any results yet, I must use this formula to compute the resistance of the wires:
Resistance = Resistivity of the material (Ωm) x Length of the wire (m)
Radius of the wire (m)
In symbols this is:
R = ρ l
Πr²
For 10cm Constantan SWG 30:
Resistivity of Constantan = 4.9 x 10⁻⁷ Ωm
Cross-sectional area = π (3.142) x 0.0001575²
= 7.794 x 10⁻⁸
So: 4.9 x 10-7 x 0.1
7.794 x 10-8
= 0.6286887349 Ω
Rounded down to 0.63Ω
From this information I can work out a table of the lengths of the constantan SWG 30 every 10cm. This should give me perfect results, which I can compare later with my actual results.
If 10com gives me 0.63Ω, then 20cm will give me 1.26Ω (x2) I can use this to make my first table. I will use the unrounded value for the resistance of 10cm for greater accuracy:
SWG 30 Constantan
SWG 32 Constantan
SWG 34 Constantan
Nickel Chromium SWG 30
I will now find predictions for Constantan SWG 32 wire.
R = 4.9 x 10-7 x 0.1
Π (0.000137) ²
= 4.9 x 10⁻⁸
5.89721980 x 10⁻⁸
R - 10cm of Constantan SWG 32 =
0.8310, which is 0.83 to 2 d.p.
The resistance of the Constantan SWG 34:
R = 4.9 x 10-7 x 0.1 _
3.142 x (0.000117)² (π=3.142)
= _ 4.9 x 10⁻⁸ _
4.3010838 x 10-8
= 1.13924774Ω
To 2 d.p. = 1.14 Ω
This is the resistance of the nickel/chromium wire (its resistivity is different):
R = 10.7 x 10-7 x 0.1
Π(0.0001575)²
R = 1.07 x 10⁻⁷
4.94800843
R = 1.373 Ω
Resistance of SWG 30 Nickel/Chromium
The lower the SWG rating of the wire, the bigger Diameter it has.
In order of increasing resistance for the same length, going down, the wires are:
SWG 30 Constantan (Green)
SWG 32 Constantan (Blue)
SWG 34 Constantan (Yellow)
SWG 30 Nickel/Chromium (Red)
This showed that when the material stayed the same, the resistance is changed by thickness, the thickest wire having the least resistance. Also, when the cross-sectional area stays constant, resistance is affected by material, the constantan wires all having less resistance than the nickel/chromium wire.
I will use my data to prove the above (on previous page), and also include proof that length affects resistance as well as material and cross-sectional area. Temperature also affects resistance however we had no way of precisely measuring this, therefore we assumed that the temperature remained constant.
Length (all other factors constant)
The values on the last row are all exactly double the values on the row above, although rounding to d.p. has slightly changed some numbers. This proves that when all other factors that affect resistance are constant, length is proportional to resistance.
Analysis
If the length increases than the resistance will also increase in direct proportion to the length.
I know this because the Line of Best Fit is a straight line through the origin showing that if the length of the wire is increased then the resistance of the wire will also increase in proportion to each other. The line of best fit is a straight and it goes though (0,0) if there is no length, there is no resistance proving that the resistance of the wire is directly proportional to the length of the wire.
The length of the wire affects the resistance of the wire because the number of atoms in the wire increases or decreases as the length of the wire increases or decreases in proportion.
The resistance of a wire depends on the number of collisions the electrons have with the atoms of the material, so if there is a larger number of atoms there will be a larger number of collisions that will increase the resistance of the wire. If a length of a wire contains a certain number of atoms when that length is increased, the number of atoms will also increase.
If the wire is half the length of a certain wire, it would have has half the number of atoms, this means that the electrons will collide with the atoms half the amount of times. In addition, if the length of the wire was trebled or quadrupled, then the resistance would also treble or quadruple... I know this because my results table shows a few, individual anomalous results.. All the other points are extremely close to the line indicating that my results are accurate.
I think that my results are suitable to confirm my prediction and support a conclusion. I know this because outside resources (Textbooks and Britannica) say that ‘the length increases in direct proportion to the resistance.´
Evaluation
All the factors I explained at the beginning have come into play here, :Length, Diameter, Material and Temperature.
As the wire length is bigger at these points I found it harder to stretch it out and consequently, measure it accurately. Although the graph is overall accurate and the results precise it is easy to see, the anomalous averages plotted because they do not all lie along the same best-fit line. The graph shows that my results are reliable as there are only two main anomalous points, (which are easily accounted for) to improve the reliability of my results, I could do more repeats in doing this my average would be more reliable.
As I increased the wire length, the wire became hotter and gave off heat. This could explain why the anomalous results are at the top of my graph, 100cm and 95cm. I think one of the reasons why my experiment is quite accurate is because I tried to measure the wire as accurately as possible. The metre rule was not selotaped onto the workbench. The wire was stretched until it was nearly in a straight line so a bit was overlapping at each end. As the metre rule was curved and worn down at the corners it was slightly hard to see where 0cm was. Finally, the inside edge of the crocodile clips were placed at the appropriate point. I still however would like to make the measuring more accurate
During my experiment, I have noticed several modifications I could make to improve on the Investigation if I was to repeat it.
The first of these modifications would be the circuit that I would use..
Instead of connecting the voltmeter to the main circuit, I would connect it to the wire that is being tested. I would do this so that the voltmeter is measuring the voltage of just the wire being tested and not the wires of the main circuit as well.
To also improve on my results I could use a new or higher quality digital voltmeter. The next modification I would make would be to use pointers instead of crocodile clips to attach to the wire; I would do this because pointers would be more accurate. The pointers would be more accurate because the tips have a much smaller area than the crocodile clips giving a more accurate measurement of the length of wire. I would also use a newer metre rule. The graph shows that my results are reliable as there are only two anomalous points, to improve the reliability of my results, I could also have repeated the same lengths of wire more times.. Sometimes the ammeters flicked between a decimal point, I maybe could have thought it was the wrong number and therefore would have ended up with the wrong average resistance. In the experiment, I did not control the room temperature but instead just assumed it was keep constant throughout my experiment; this could have made the wire get hotter and therefore making my experiment not as accurate. In future experiments I would control this variable factor and make it a constant factor. I would do this, as it would be an unfair test if there were two known variables.
As well as making these modifications, I could also expand on my investigation by testing the same wire but different widths of that wire. I would do this if I had more time to complete it. I think the circuit and method used was quite suitable although I would make the modifications above to improve my results. If I did this experiment again I would defiantly use top quality equipment, I would probably control the temperature and use pointers instead of crocodile clips. After changing those few things, there is not really much difference to how I would do the experiment again.