Different materials have different resistance depending on the materials’ atomic structure (composition). The type of material affects the amount of free electrons there are. The number of free electrons depends on the amount of electrons in the outer shell of the atoms. If the material has a high number of atoms or if there are more electrons in the outer shell or even if the atom is large (meaning that the electrons are weakly attached to the positive nucleus), the more electrons there are available. This will cause a lower resistance because of the increase of the number of electrons. If the particles in the material are tightly packed together, then there will be more collisions and therefore more resistance.
Some conductors are better than others. Copper is a better conductor of electricity than iron. In different conductors the ease of flow of the electrons is different and so the conductors have different resistance. Constantan is a metal alloy – its composition is 60% copper and 40% nickel. In a metal, the pathways for the electrons to move are regular since the atoms/ions are all the same size. In alloys, there are different sized ions and so the electron pathways are irregular and so it is more difficult for the current to get through therefore creating a higher resistance. During this experiment, I have already decided that I will use constantan since it has a high resistance and so will have a lower current, which will be safer to use than use a material with a low resistance.
As I have mentioned, I have decided not to investigate the factors of temperature and type of material. Investigating temperature is difficult to control since it is hard to control the range of temperatures needed without the correct apparatus. I have decided not to investigate type of material since there are not a sufficient number of materials for me to investigate how this factor affects the resistance of a wire. Another disadvantage of investigating type of material is that it does not provide continuous data, consequently, not giving a good line graph.
Prediction and Hypothesis
Factor being investigated: Length
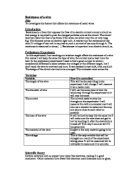
My prediction is that as the length of the wire increases, so does its resistance. This prediction is based on the theory described above. It is also true that doubling the length of the wire will double the resistance. This means that resistance is directly proportional to the length of the wire if the cross-sectional area is constant:
R ∝ L
This means that the graph of resistance against length will be a straight line through the origin.
This is the type of graph I expect if the voltage is being kept constant and if the wire does not heat up at any point in the experiment.
Factor being investigated: Cross-sectional Area/Diameter
My prediction is that doubling the cross-sectional area of the wire will halve the resistance. This prediction is based on the theory described above. The resistance of a wire is inversely proportional the cross-sectional area of the wire as long as the length of the wire is constant.
R ∝ 1
Α
This means that the graph of resistance against1/cross-sectional area (A) will be a straight line through the origin.
Health and Safety Precautions
In order to prevent any accidents to both me and the other students, or any damage to the equipment, I will have to do the following:
- I will not use Mains electricity to conduct this experiment since it is very dangerous.
- I will be extra careful when I am conducting my experiment at 4.5 volts since the wire may get heated up due to a higher current. That is why it is safer to use a lower voltage such as 3V since it decreases the current and therefore minimises the chance of the wire from overheating or even melting (the current must be kept within certain limits). (I have decided that I will conduct my experiment at both 3V and 4.5V to prove that constantan’s resistance is not affected by a change in temperature.)
- I will not use lengths of wire, which are lower than 10cm, because current rises if shorter lengths of wire are used. Using longer lengths of wire will help to reduce currents and therefore reduce the wire from getting too hot.
- I will have to conduct the experiment in a dry area, where no water is present since water should never come in contact with electricity (water is a good conductor.) In addition, I must not touch electrical apparatus with wet hands.
- Where I can avoid it, I will not touch the wire while the power supply is switched on or soon after the power supply is switched off because the wire may be hot. However, it is necessary to touch the wire to find out if it is getting hot and so I will do this with caution.
- If I suspect too high a temperature rise than I will wait for things to cool down and then check the last readings again.
- I will disconnect the circuit when it is not in use – for example, when I am recording the results. I will also make sure that the circuit is not left on for too long.
- I will make sure that the power supply is switched off when I want to change the wire in the circuit.
- I will be aware of frayed cables or wires.
- I will have to work tidily – for example, I should not leave any large electrical apparatus on the edge of the bench.
Preliminary Experiments
Preliminary work helps to identify any mistakes with your planned method and will help me to make my main experiment fairer and more reliable. By doing some preliminary work, it will be more likely that I will obtain precise evidence in my main experiment.
I will carry out a preliminary experiment to find the following:
- A range of values for the length of wire that should be investigated.
- The best voltage(s) to use so that the wire does not get too hot.
- What type of materials to use in my final experiment.
- Appropriate apparatus that will help me obtain precise evidence.
- A suitable method of conducting this experiment.
I started my preliminary work by setting up a circuit to measure the resistance of a nichrome wire of diameter 0.28mm. In this trial experiment, I decided to keep the current constant because it would mean that the temperature would remain constant. I measured the wire, which was 1m long, and decided to take readings every 10cm. I took the voltage reading every 10cm up to 1m, making sure that each time the current was constant at the particular length of wire (The current in the nichrome wire of diameter 0.28mm was 0.43A) I recorded the results in a table.
I then repeated the experiment using a nichrome wire of diameter 0.31mm. This time, the current was 0.25A. I must use the same current throughout the series of experiments since it would affect the fairness of the test. One way in which I could make the current the same would be to change the voltage on the power pack. I did this, and though it enabled me to get the same current, I noticed another problem. When I was trying to find the correct voltage to match the current to that of the nichrome wire of diameter 0.28mm, I noticed that the wire got hot. This would mean that the resistance would have changed (it would have increased). This determined that this method would not work since it would be an unfair test.
Another way in which I could conduct this experiment would be to use a variable resistor (rheostat), which would enable me to control the current. However, through research, I learnt a very important fact that meant that it was not necessary for me to keep a constant temperature during my experiment for a particular material. This material was Constantan. Constantan is a metal alloy, which shows very small resistance change with temperature under normal laboratory conditions (Constantan only increases resistance by about one-hundredth-thousandth part per Kelvin rise in temperature). Knowing this fact, I decided that I would base my main experiment on constantan rather than nichrome since nichrome wire will get hot during the experiment and Ohm’s Law will no longer apply. Experimenting only on constantan meant that it was not necessary for me to keep the current constant. I therefore decided to do some preliminary work to find a suitable voltage to use (since I will keep the potential difference across the wire constant) and a range of values that should be investigated for the length of wire.
I started by trying a voltage of 4.5V, but this gave me a rather large current and the wire heated up quite quickly. I found that my trial experiment worked much better at 3.0 volts. Although the 4.5 voltage gave me a high current, it was not high enough that it would cause accidents for the users or damage to the equipment. Therefore, I decided that I would conduct my experiment at both 3.0 Volts and 4.5 Volts to prove that constantan’s resistance is not affected by a change in temperature (I will take ammeter readings of constantan at two different diameters set at 4.5 Volts and two different diameters set at a voltage of 3V. I will compare the graphs drawn at 3.0 Volts with those drawn at 4.5 Volts).
During my preliminary, it was important to find a range of values to investigate the length of the wire. Looking back at the theory, I decided that it was best to use a wire of length 1 metre because short wires get hot very easily which means that it is not a safe experiment and that it will be very difficult to take measurements. I will take readings every 10cm, which will give me enough points to plot on the graph and to make suitable comments.
Preliminary work helped me to decide what apparatus to use in my final experiment in order to obtain precise evidence. For example, rather than use a pointer as the contact between the electricity supply and the wire, it is more accurate to use crocodile clips because, unlike the pointer, you do not have to hold them in place.
In my preliminary, I also looked at whether I should use an analogue ammeter or a digital ammeter. I found the digital ammeter to be particularly useful since it had a wide range of values of current. The digital ammeter also provided accurate and reliable results unlike the situation of an analogue ammeter, where you had to read off a value and would have often brought about inaccuracies. I also decided that it was unnecessary for me to have a voltmeter in my circuit since the voltage was being kept constant.
In my preliminary work, it was not necessary for me to find a suitable value for the length of wire used when investigating the effect of cross-sectional area since I had decided that I would take ammeter readings at 10cm intervals of a length of 1m wire. I would investigate the effect of cross-sectional area by comparing the different thicknesses of the wires at particular lengths.
Apparatus to be used in main experiment
- Digital ammeter – I am using a digital ammeter compared to an analogue ammeter to measure the current (I) in the circuit because it is easier to read accurately. Note that an ammeter is always placed in series with the resistance, and so ammeters should have a low resistance so that they do not introduce unwanted resistance.
- Two crocodile clips – to connect the wire being investigated with the rest of the circuit.
- Metre ruler – to measure out the length of the wire (I am using a metre ruler rather than an ordinary 30cm ruler because the lengths I am measuring are too big for a smaller ruler. In addition, the metre ruler can be accurate to each millimetre).
- Battery pack – to provide the “electrical push” to the current.
- A few Constantan wires of different diameters, each which is 1m in length.
-
Connecting wires – to connect all the components together in the circuit.
Method
Measuring Resistance There are two ways in which we could measure the resistance of a wire. The first one is to use an ohmmeter. Ohmmeters are useful in the sense that they provide a quick and direct readout. However, I have discovered that it would be more accurate for me to work out the resistance of the wire using the formula:
Resistance = Voltage/Current or R=V/I
since you do not have to worry about the resistance of the connecting wires.
In order to be able to find the resistance using this formula, I must measure the potential difference across the wire being investigated (in Volts) and the current through the wire (in Amps).
Number of measurements
Resistance and Length
The length of the Constantan wire between the crocodile clips will be varied from 10 cm to 100 cm and I will take ammeter readings in 10 cm intervals i.e. 10 cm, 20 cm, 30 cm etc. This will give a total of 10 pairs of values (since I will repeat the whole experiment once), which is a good range or results and an adequate number of measurements to allow me to draw the predicted straight-line graph.
Resistance and Area
In order to investigate the cross-sectional area, I had decided that I would take ammeter readings at 10cm intervals of a length of 1m wire. I would investigate the effect of cross-sectional area by comparing the different thicknesses of the wires at particular lengths.
I would work out the cross-sectional area of the wire (in m²) using the formula:
A = π x (radius) ²
= π x (diameter/2) ²
or, in m², A = πd² /4
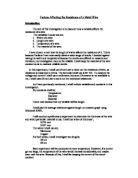
Diagram:
- The circuit was set up as in the diagram above.
- I marked out the length of the wire between 10cm and 100cm in steps of 10cm, i.e. 10cm, 20cm etc on the wooden board using a meter ruler.
- It was made sure that the Constantan wire under test was free of bends and kinks and that the wire was taut because it would have short-circuited. To make sure that it was taut, I let go of the wire (since the current might come through me) and observed the current for 10 seconds.
- The battery pack was set to 4.5 Volts.
- The length of the wire between the crocodile clips was set to 10cm using the meter ruler (the diameter of the wire at this stage was constant).
-
When the power was applied, I recorded the length of the wire and the reading on the ammeter (I1) (I made sure that when I was recording my results, the circuit was disconnected to prevent the wire from getting too hot).
- Steps 4 and 5 were repeated – each time I increased the wire length by 10cm until the length of the wire was 100cm, which was my last reading. (Note that I started taking readings at the shorter lengths of wire and gradually increased to the longer lengths because this meant that the wire was not hot for the lower readings).
- The whole experiment was repeated in order for me to obtain accurate and precise results to analyse.
- I then conducted all steps 1-7 but using a voltage of 3 Volts.
- To investigate the effect of cross-sectional area, I repeated this whole experiment but using different diameters of wires. I investigated two diameters of constantan at 4.5 Volts (diameters were 0.45mm and 0.31mm) and another two diameters at 3.0 Volts (diameters were 0.20mm and 0.40mm). Note that I did not have to measure out the diameter of the wire using the Micrometer screw gauge since it was already done for us.
Measurements:
- The length of wire (L) between the crocodile clips was measured using the meter ruler.
- The current through the wire was measured using the ammeter.
- The voltage used from the battery pack was noted.
Ensuring Accuracy…
In order to keep my experiment a fair test, I will have to do the following:
- I must make sure that I am only changing one variable at a time.
- I will make sure that the wire under test is straight and free of bends and kinks and that the wire is taut so that the wire does not short-circuit. If this happened, it would affect the accuracy of my experiment.
- The type of material being investigated must be kept constant since different materials have different conductivity therefore affecting the resistance of the wire.
- I will use the same apparatus throughout the experiment.
- To ensure reliability of the equipment and consequently, the accuracy of my experiment, I will check all the apparatus to see if all is functioning property. For example, ….
- I will have to measure the length of the wire precisely.
- The power supply must be kept at 4.5V and 3V(In this way, I can compare the two factors at the higher current (i.e. high voltage) with the two factors at the lower current.
- I must take the readings at the same intervals throughout the experiment – for example, the length of the wire will be measured every 10cm.
- I will compare cross-sectional areas at the same length of wire to see the effect of thickness/diameter on the resistance.
- I will switch off the power pack between readings to ensure that my wire does not get hot. Even though Constantan’s resistance is not affected by a change in temperature (as stated in theory), it is still important that the wire does not get too hot to prevent any accidents or damage to equipment. It is also important that the wire does not get too hot since I may later want to take this experiment further and compare these results with those of Nichrome.
- The experiment will be duplicated to show up any inaccuracies, keeping all the above factors the same. This will ensure that I obtain precise and accurate evidence.
Obtaining Evidence
The resistance was calculated using each of the values of voltage and current using the formula: R = V/I
The cross-sectional area was calculated using the formula: A = πd² /4
As you will see, my repeated current results are very close to the original current readings, which imply that my measurements were accurate. Note that all the results gathered from the ammeter were set to 2 decimal places and so I have also put the other results to this degree of accuracy.
Results
Constantan wire, diameter 0.45mm
Area of cross-section = πd² /4
= (π x 0.45²) /4
= 0.159 mm²
SWG26
Constantan wire, diameter 0.31 mm
Area of cross-section = πd² /4
= (π x 0.31²) /4
= 0.075 mm2
SWG30
Constantan wire, diameter 0.20 mm
Area of cross-section = πd² /4
= (π x 0.20²) /4
= 0.031 mm2
SWG36
Constantan wire, diameter 0.40 mm
Area of cross-section = πd² /4
= (π x 0.40²) /4
= 0.126 mm2
SWG28
Observations during the performance of experiments which could have affected the validity of my results
- One of the main observations through my experiment was that the wire got hot at the lower lengths of wire and so considerable cooling was required.
-
When testing constantan diameter, 0.40 mm, I found that there was too much fluctuation of the current reading on the ammeter, which was probably because of some sort of loose connection. Even though I waited 10 seconds before I noted the current, the ammeter reading kept changing. In order to ensure that my evidence collected was precise, I repeated the experiment again – I decided that I would not use the first set of readings since these results looked out of place with the others.
After gathering results, I decided that when I plotted the graphs, I would plot the two sets of readings on one graph and then draw a line of best fit. If I had worked out an average of the readings, it would not have shown me how close the results were.
Note that on the graph, the blue dots represent the first set of readings and the black crosses represent the second set of readings.
Analysing and considering evidence
At this stage, I decided that I will not go any further on investigating the factor of cross-sectional area on resistance because unfortunately, I did not have enough time to take enough readings for different diameters of wire at the same length and at a constant voltage supply. This means that I do not have enough readings to draw a suitable graph. Without enough readings, I will not be able to come to an accurate conclusion.
Conclusion
In the prediction, I stated that I expect that the longer the wire, the greater the resistance. This is because there are more collisions between the electrons and the ions in the metal. My experiment has been successful since my results agree with the prediction (See page 2, under the heading Length). All the graphs agree with the theory that resistance is directly proportional to length. They all show that resistance increases with length. Although my results do show the trend between resistance and length, there are a few anomalies on the graph, which suggest that either the wire was getting hot, or perhaps the voltage may not have been constant. A battery that was running down could have also had an effect on my results. Except in some cases, it is noticeable that my duplications of the current readings and consequently the resistance readings matched well which meant that the basic experiment design was fine and that my evidence was accurate and reliable.
Another point to make is that if we compare the graphs where the results were taken at 4.5V with those that were taken at 3V we can see that the results taken at 3V show a consistent pattern and appear to fit the best-fit line more accurately. The results taken at 4.5V are more scattered, especially at shorter lengths of wire. Therefore, if I were to improve this experiment, I would also take readings at 1.5V, which I assume would have more readings on the line of best fit. If we compare the graphs where the results were taken at 4.5V with those taken at 3V, it appears that Constantan’s resistance is being affected by something: This could a rise in temperature or the fact that the voltage is not being kept constant. If I were to take further experiments, I would concentrate on finding out what is affecting this wires resistance.
In particular wires, e.g. Constantan, diameter 0.45mm, the wire got so hot that I had to cool it down after each reading at the shorter lengths. However, some constantan wires being hotter than others should not affect the accuracy of my experiment since, as we have encountered, constantan only increases resistance by about one-hundredth-thousandth part per Kelvin rise in temperature.
As I mentioned in my observations, when I tested constantan wire, diameter 0.40 mm, I found that the current reading on the ammeter was fluctuating to a huge degree. This was probably because of a break in the circuit – the circuit may have been nudged so that the wire was not in total contact.
If we look at the graph of current against length for Constantan, diameter 0.20mm at 3V, we see that as the length of the wire increases, the current decreases (as predicted). However, the current is not decreasing proportionally to the length, which suggests that something else is changing. But it is noticeable that a straight line can be drawn at the lengthier readings meaning that Ohm’s Law applies for longer lengths of wire. It is also seen that there is a big current difference when the wire is at 10cm to when the wire is connected at 20cm. This is possibly because the voltage may be fluctuating which has had an effect on my results. If I were to repeat this experiment, I would measure the potential difference across the wire to see whether the voltage is being kept constant:
Evaluating the Evidence
Conclusions
Through my research and my investigation I have found the following:
-
Length: The longer the wire the more resistance (see page 2 under heading Length for theory)
-
Diameter – thin wires have more resistance than thicker wires (see page 2 under heading Cross-sectional area/ diameter for theory).
-
Type of material – alloys have a higher resistance than pure metals (like copper). Nichrome has a higher resistance than constantan (for the same length and same thickness). (See page 3 for theory).
-
Temperature - Hotter wires have more resistance than cooler wires (see page 3 for theory).
Anomalous Results
All the readings fitted with the general trend, which was as the length increases, the greater the resistance. Therefore I can conclude that the basic design of my experiment was fine and that my evidence is precise and reliable. However, there was one point in particular when I was investigating constantan wire, diameter 0.31 mm that I have highlighted on the table of results in the Obtaining Evidence section which did not seem to fit correctly. This was probably because at that point, there was a loose connection. Anomalies could have also occurred when the wire may have got hot or where the voltage was perhaps not constant. A battery that was running down could have also had an effect on the results.
Uncertainties
- It was difficult to make sure that the wire was totally free of kinks or bends. Kinks or bends in the wire would have meant that the wire was actually longer than the measured value. If the wire looped over, it would also short-circuit which would mean that the wire would be shorter.
- The value on the ammeter varied which probably led me to write down incorrect results. This would have eventually led me to have a higher or lower resistance of the wire than it actually was.
- The length of the wire may not have been exactly accurate since I could have measured the wire a few millimetres off, which may have affected my results. Inaccurate measurements happened more at the thicker wires at 1m since the crocodile clips were not able to reach this length because the wire was too thick.
- At times where the wire was thicker, I would increase the contact between the crocodile clip and the wire and other times, I would ensure that only the tip of the crocodile clip was in contact with the wire. The contacts between the crocodile clips and the wire may have introduced extra resistance into the circuit. The amount of extra resistance cannot be estimated since it would have changed in different experiments.
How could I improve this experiment to give me more precise evidence?
- If I were to redo this experiment or improve on it, one thing I would do to ensure accuracy would be to allow the wire to cool down between each reading rather than between each set of reading. I conducted the experiment allowing the wire to cool down between some readings (especially at lower lengths since wire got quite hot) and not others, which could have made my experiment an unfair test. Although cooling the wire between each reading would be extremely time-consuming, it would ensure me to gain precise evidence and I could take this experiment further and compare my results with those from nichrome (If I conducted this experiment on any other material, it would be very important to make sure that the temperature does not change since it will affect the wire’s resistance). In my preliminary, I would decide how long I would allow the wire to cool down for e.g. 2 minutes, 5 minutes or 10 minutes.
- If I would have completed investigating the factor of cross-sectional area on the resistance of a wire, then I would have liked to use a Micrometer Screw Gauge to make sure that the diameter/thickness of the wire was consistent all the way along. I would measure the diameter at different angles in case the wire was oval-shaped which would affect the readings.
- Another way in which I could have improved the accuracy of my experiment would have been to use longer lengths of wire e.g. I could investigate on a 2m wire. This would have given more results that obeyed Ohm’s Law since longer lengths of wire do not have large currents passing through them, therefore preventing the wire from becoming too hot.
- If I were to have taken this experiment further and investigated how nichrome affects the resistance of a wire, it would have been better to have done the tests in one day rather than over several different lessons, because nichrome’s resistance, unlike constantan’s, is affected by a change in temperature. Doing experiments over several days would have meant that the wires, components and meters would have been different therefore affecting the ammeter/voltmeter readings.
- I could have done more tests around any anomalous points that I found to ensure the accuracy of my experiment.
- I should have done my experiments at 1.5V as well as 3V and 4.5V because I assume that the results at 1.5V will be much more accurate since a lower current would be applied. Where a lower current is applied, you need to measure to 3 decimal places – it is therefore necessary to use an ammeter.
-
I would add a fixed resistance in the circuit as well as the length of the wire, which would ensure that my readings are accurate.
One suggestion made from a source of reference to improve the experiment would be to place the wire in a water bath to let the heat flow out and keep the temperature constant (i.e. the temperature of the wire would have been the same as the water bath). I would not do this because it is dangerous to allow electricity to come in contact with water.
Future experiments
- To improve upon the results that I have already made, the next stage in this experiment would be to measure the potential difference across the wire rather than have relayed on the battery pack maintaining a fixed voltage as the current changed.
- I would use different types of resistance wire (e.g. manganin) to compare them to constantan – if I were to do this, it would be very important to keep the temperature constant for example by using a variable resistor.
- I would take more readings for different diameters of wire at the same length and at a constant voltage supply. This would then allow me to plot a graph and come to an accurate conclusion.
In the future, I would also like to compare my figure of length with the theoretical resistivity of constantan to validate my readings. Through research, I have come to know that the resistivity of Constantan is: 5.0 x 10⁻⁷ Ohmic metres.