-Do not touch the wire it may get hot and possibly burn you.
-Do not increase the voltage to much, it will increase the temperature of the wire and will turn red hot then burn.
Variables / controlling the experiment
The length of the wire is what I will mostly change in this experiment. This will alter resistance of the wire. When the length of the wire increases, the electrons will have to pass through more and more atoms in the wire. More collisions will happen, this means that there will be more electrons bumping through the atoms in the wire. When the electrons bump into each other this has 2 effects, firstly it slows down the rate in which electrons can pass through, and the kinetic energy will be transformed into thermal energy. Not all of the electrons will pass through the entire peace of wire some will be left behind. This therefore means by increasing the length the resistance will also increase. I will change this variable to investigate the resistance based on the length of wire.
I will keep the thickness of the wire constant for the obvious reason. If we change the resistance of the wire the resistance will also change. This is because the thinner the wire the fewer gaps there are going to be for the electrons to pass through. The more gaps the more space there will be to allow the electrons to pass through the wire. Therefore we will keep this constant to allow a fair test.
I will also try my best to keep the temperature of the wire the same. The temperature varies because when the electrons bump into the atoms, due to the friction caused in the crash of electrons, kinetic (or thermal) energy is generated. And to a certain level, the electrical energy carried in the electrons is transferred in to kinetic energy as well. It is very hard to control the temperature. After every single experiment I will have to turn of the machine, if I leave it on it will heat up the wire which will make it an unfair test.
We will also have to keep the type of wire constant. This is because by changing the type of wire we also change the density of the wire, and the amount of atoms inside the wire, which could therefore affect the resistance of the wire.
Preliminary Work-
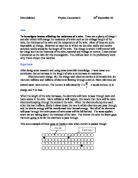
An experiment was carried out to ensure the experiment would work properly. It was set up as follows. The wires used were Nichrome with gauge of 28, 30, 32, and 36. Copper with gauge of 28, 30, 32, 36. Constantan with gauge of 28, 30, 32, 36. For each of these pieces of wire I recorded three different lengths 200cm, 100cm and 20cm. We set up the experiment as follows.
Results-
As we can see from the experiment our experiment will work because the current passing through each of the wire is increasing as the length of the wire is shortened.
For my experiment I will use Constantan, This is because it gave me the widest range of results, so it makes it easier for us users to see and understand what’s going on. The thickness I will use will be 32. This is also because it gave me the widest range of results. I also chose this type of wire because it did not get hot very easily. This is a good thing because it will be a fairer test (when temperatures stay relatively the same) and there is less hazards involved.
The length of wire I will use-
I will use the following lengths of wire-
20, 40, 60, 80, 100, 120, 140, 160, 180, 200. I think these lengths of wire is suitable for the experiment. 10 lengths is good enough to show us a general pattern.
Equipment-
-Ammeter
-A 1m ruler (to measure length of wire)
-At least 8 electrical cables
-Voltmeter
-Power Supply unit
-at least 600cm of Constantan
-crocodile clips
Method-
- Connect the electrical circuit as shown in the preliminary work. Make sure all the wires all connected correctly. Note that the voltmeter has to be connected in parallel because it has a very high resistance, current will not be able to go through.
- Before doing anything else, set the voltage of the power supply unit to 0V. Then turn on the power Supply unit (PSU).
- Connect the piece of wire of desired length to the two crocodile clips (both ends)
- Now set the PSU dial to 2. Turn on the Machine. Allow readings to settle then record readings from the ammeter and the voltmeter.
- Turn of Machine. (avoid the wire getting hot)
- Do the same adjusting the dial switched to 2, 4 and 6. Change the lengths of the wire each time using the following lengths- 20, 40 60, 80,100, 120,140,160,180,200cm. Record the readings from the ammeter and the voltmeter.
- Once you have finished all the experiments you have to divide the volts by the current (amps) to find out the resistance. It is explained how to do this in the analysis later.
Analysis
Analyzing the Graph-
From the pattern on the graph, we can tell that my prediction was correct. An increase of length gives you an increase in resistance. This can be seen because the line of best fit is moving upwards while the length of wire is increased. All the points on the graph are almost on the line of best fit, it was very easy to draw the line of best fit. There were one or two points that did not fit the line completely. These were the last two lengths. 180 and 200cm. This could have happened due to some experimental errors. The graph proves that as the length of the wire increases the resistance of the wire increases proportionally. This means that if we double the length of the wire we also double the resistance.
How I calculated the results-
Resistance = Voltage / Current
So for example: Voltage = 0.51V, current = 0.15A. Therefore resistance = 0.51 / 0.15 = 3.95Ω
I then averaged all the results (readings on the dial 2, 4 and 6) to come up with a final pair of results which used to plot on the graph.
Conclusion-
From the graph we can tell that almost all the points are on the line of best fit. The length of wire and the resistance is directly proportion to each other, as in they rise together. If we double the length of the wire the resistance will too double. This proves that the resistance of the wire will vary according to the length and width of a wire. The longer the wire the higher the resistance.
The length of the wire and the resistance rise together. The increase in voltage is increasing the amount of energy transferred every second in the circuit. My theory is, if length of the wire increases, there is less chance for the electrons to go through. Most of them bump into the atoms inside the piece of wire, therefore increases resistance.
According to my graph my prediction was correct; a rise in length is a rise in resistance.
Evaluation
Problems encountered-
The problems encountered were very mild except for when we were taking measurements for small lengths of wire. The wire got very hot; it was difficult to take readings because the readings on the meters kept on changing in high ranges.
How accurate were my results-
My results may not have been extremely accurate however when we draw the line of best fit we can see the pattern quite clearly. It is good enough for us to find and interpret a pattern from the line of best fit. The ruler we used may not have been entirely accurate. Also, the voltmeter and the ammeter is limited to 2 decimal places, and are not entirely stable (the readings are always changing). We can only measure an approximate reading. How ever as I said earlier I feel my results are good enough to show us a general idea of what is happening.
Comment of the overall experiment-
Overall, I feel that the experiment was done in a quite good state. Yes there were 1 or 2 anomalous results; however the line of best fit still turned out as expected. 10 results is good enough for us to draw a decent and accurate line. All in all most points lie very closely to the line of best fit. The line is quite reliable as it turned out as expected (i.e. it matches my prediction) and it also matches the research I had done previously. It shows us a general pattern of the length of wire and resistance being proportional.
Things I could have done better-
The experiment could have been done much more accurately. I could have used a more reliable ammeter and voltmeter so readings can be more accurate, they can be more stable and corrected to more decimal places, in this case there will be fewer errors in the graph. We could also have used fewer wires. The wires we use have a very slight resistance, therefore affecting the experiment slightly.
Besides all this there is not much else we could have done. The experiment could have turned out better if the equipment used was much more advanced (explained above). However as said earlier the results are good enough to show me a general pattern and allow me to analyse what happens.