I think this plan is a good way of conducting this experiment because, as well as investigating precisely what we want to know – how length affects the resistance of a wire, it is relatively easy to carry out. Although these other factors (above) do affect resistance, they are not practical variables to investigate. Changing the temperature and thickness of the wire would be a very complicated thing to do and one that would have to be done extremely accurately to produce accurate results, whereas altering the point at which the wire is connected to the circuit is very straightforward and less time consuming.
Prediction
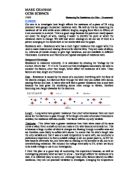
I predict that the as we increase length of wire connected to the circuit, the resistance will also increase. I think this because in a shorter wire, the charges (electrons) haven’t as far to go, and therefore they are more likely to avoid the collisions with atoms, which result in resistance. I am expecting readings, which show a decrease in resistance when the length of the wire has been decreased.
Connecting the circuit/Apparatus
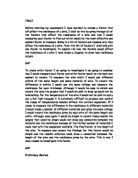
Firstly we will connect up our series circuit (bellow). The circuit will consist of an Ammeter, a Voltmeter, a power pack, five long pieces of insulated copper wire and one meter of 24 s.w.g Constantan resistance wire, which will be mounted onto a piece of wood, marked off at every 10cm point in pen. The Ammeter will allow us to measure the current flowing through the circuit (amps). It has to be connected in series, whereas the Voltmeter, which will allow us to measure the voltage or push of the electrons going through the resistance wire (volts), has to be connected in parallel. Although, with our preliminary work in mind, we will set the power pack to 2V the Voltmeter is a far more accurate device for determining the voltage. The mounted resistance wire will be connected to the circuit by crocodile clips. It is essential that we connect all of these aspects of the circuit properly to conduct an accurate investigation.
Series Circuit Diagram
OBTAINING EVIDENCE
Method/Readings
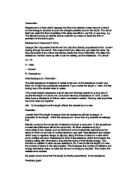
As resistance is calculated by dividing the voltage by the current we have to measure both when the seven different measurements of the resistance wire are connected to the circuit. We will take our first voltage and current readings at 40cm and record the data in a table. Next, we will move the crocodile clip connecting one end of the wire along to the 50cm mark and record the voltage and current at this point, and again at 60cm and so on up to 100cm. Once we have our voltage and current readings from our seven different points on the resistance wire, we will move the crocodile clip back to the 40cm mark and repeated the experiment.
Averages/Calculating Resistance
To remove any experimental errors that may occur whilst conducting this investigation we will repeat the experiment until we have four sets of results. Then we will calculate the resistance at each measurement in all the experiments by dividing the voltage readings by the current readings, and then finally calculate the average current, voltage and resistance at the seven points on the resistance wire.
Results Tables
2.14 Anomalous reading
2.17 Anomalous reading
1.90 Anomalous reading
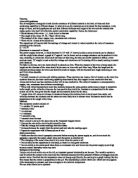
Calculated Averages.
ANALYSING AND CONCLUDING
Conclusions
The results show a definite rise in resistance when the length of the wire was increased. This relates to my knowledge of current and resistance, and concurs with my prediction. As we increased the length of the resistance wire connected to the circuit, the resistance went up. This was because in a longer piece of wire the electrons have got further to travel, and therefore the chances of collisions with the atoms of the conductor, which result in resistance, are increased. The graph clearly indicates a pattern between the increasing resistance and the increasing length of the wire, as do our results tables.
EVALUATION
I think the experiment went well, and that the method was, indeed, a good way of conducting it. It was easy to produce accurate results, it involved only the one variable we wished to investigate – length. Also, it was practical to do, unlike using other variables, i.e. thickness and temperature. Our results appear on the whole to concur with my prediction and background knowledge of current and resistance. By increasing the length of the resistance wire we have increased its resistance. I think we have enough correct results to draw this conclusion. There is no indication that the resistance will do anything but increase as the wire becomes longer.
Experimental errors
The relationship between the voltage and current at a particular point on the wire, given the resistance at that point, is what I expected. It is logical that there needs to be a greater voltage to push the current through a higher resistance. For example, the highest voltage we encountered was 0.60V when the full 100cm of the wire was connected to the circuit, which was needed to push a 0.29A current through a 2.07Ω resistance – the highest resistance we encountered, too.
There clearly are several anomalous readings shown in both the results table and the graph. If the length of a wire of constant thickness, as ours was (standard wire gauge), is doubled the resistance should also double. In our results table though, the resistance has not doubled between the two measurements, 40cm and 80cm. I don’t think, however, that this is a sign of inaccuracy because the calculated resistance at 80cm is only just over half of that of 40cm, and I didn’t expect an exact doubling of resistance anyhow, given the sensitivity of the Ammeter and Voltmeter we were using. This could also be down to an inaccuracy when marking the 10cm points on the wood on which the wire was mounted. If any of these marks had been out by a millimetre or two the results could have been altered.
Note that the plotted readings on the graph show an increase in the resistance in a straight, diagonal line from the first reading at 40cm to the fourth at 70cm, and then there is a sudden increase in the resistance from 1.51Ω to 1.81Ω between the measurements 70cm and 80cm, a difference of 0.30Ω. The only other differences between our results were 0.10Ω, 0.16Ω, 0.21Ω, 0.24Ω and 0.20Ω, so clearly this is an increase in the resistance, which does not fit the pattern both before and after it, and it could be the result of several experimental errors, some possibilities being an inaccurate measurement or calculation along the way. Another possibility is a sudden increase in temperature of the wire during a reading. An increase in temperature that could have given the atoms of the copper wire more energy to interfere with the passing electrons, however, is an unlikely cause of this anomalous result, because a change of even a few degrees would not have altered the results, again, given the sensitivity of the Voltmeter and Ammeter we were using. This is one of the reasons I think most of our results were good.
Improvements/Further Investigation
To make the experiment more accurate we could keep the current constant and low to ensure the wire’s temperature also remains constant, therefore lowering the chance of a rise in temperature that might give the wire’s atoms more energy to interfere with the passing electrons. This improved experiment would give better, more precise results, and possibly, depending on what the cause of our anomalous results was, give a straight line on the graph of results.
If I had more time I could conduct more experiments to find out more about the resistance of a wire. I could investigate the effect of temperature by heating the wire. If so, I predict that this will result in a higher resistance due to the heat giving the wire’s atoms more energy to interfere with the passing electrons. I could experiment how the cold affects the resistance, too, but it would be complicated to keep the wire at a constant temperature for a fair test in both experiments. Another experiment I could conduct to find out more is the effect of changing the material from which the wire is made. I already know that better conductors have a lower resistance than poor conductors, so if I did this I would expect a higher resistance with the less good conductors of electricity. This would be a relatively simple experiment to conduct. I would simply have to measure the resistance of each conductor and determine how by altering the material of the wire I have changed it.