If I plot a graph of length on the x-axis against resistance on the y-axis. From the relation R = ? L /A which corresponds to the st. line equation ?
Y=max the graph should be a st. line passing through the origin where ”m“ is the gradient of the st. line graph and corresponds to ?/A. Since the cross-sectional area of the wire can be found by knowing it’s diameter. Therefore the resistivity of Nichrome can be calculated. ?
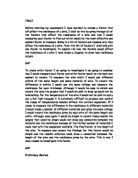
Diagram of the circuit used in this experiment
List of the apparatus used: -
- Power pack supply of 4V
- 2-A variable resistor
- 3-A full scale deflection ammeter with a measuring range of 0-1 A
- 4-A digital voltmeter with a measuring range of 0-5 V
- 5-P, Q represents terminal blocks.
- 6-Circuit wires
- 7-PQ=Nichrome wire
- 8-A meter ruler
- 9-Micrometer screw-gauge
- 10-Sellotape
GAP
FOURTH
Resistance of a Wire
Task
To investigate how the resistance of a wire is affected by the length of the wire.
GAP
Variables
Input:
Length of wire. *
Material of wire.
Width of wire.
Starting temperature of wire.
Output:
And thus the resistance of the wire.
Voltage across wire.
Current in circuit.
Temperature of wire.
The variable marked with a * will be varied, the other input variables will be kept constant. The output variable marked with a † will be measured.
Predictions
The longer the wire, the higher the resistance. This is because the longer the wire, the more times the free electrons will collide with other free electrons, the particles making up the metal, and any impurities in the metal. Therefore, more energy is going to be lost in these collisions (as heat).
Furthermore, doubling the length of the wire will result in double the resistance. This is because by doubling the length of the wire one is also doubling the collisions that will occur, thus doubling the amount of energy lost in these collisions.
Method
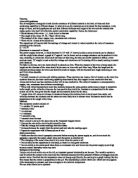
The following circuit was constructed to perform the investigation:
The two dots ( ) represent the crocodile clips that were placed at the ends of the required length of wire.
One metre length of 0.4mm diameter “constantan” (a metal alloy) wire is fixed to a metre rule.
- The first crocodile clip is clipped to the wire at the 0cm position on the metre rule.
- The second crocodile clip is clipped to the relevant position depending on the required length of wire.
- The power supply is turned on. The voltage and current are then read off the ammeter and voltmeter, and recorded.
- The power supply is then turned off and the second crocodile clip is moved to the next position.
The above steps are completed for each length and then the entire investigation is repeated for accuracy.
Rough Trials
In order to decide upon the voltage and lengths of wire to use in the final experiment, the following rough trials were carried out:
At 3V:
At 5V:
After performing these rough trials, it was decided that 3V would be used in the proper experiment, as it provided results from 10cm up to 100cm and the higher voltage provided no additional ease of measurement.
Furthermore, it was also decided to allow the wire to cool between experiments as considerable heat was noticed at lower lengths and, as mentioned above, an increase in temperature results in an increase in resistance. By allowing the wire to cool between experiments a fair test could be assured.
Safety
In order to perform a safe experiment, a low voltage of 3V was chosen so that overheating was minims lied Furthermore, lengths lower than 10cm were not tried, which also helped to avoid overheating.
Results
Wire 1, Set 1:
Wire 1, Set 2:
Having completed two sets of results for one wire, it was noticed that these was a large black mark towards one end of the wire, where it appeared that it had been melted to some degree at some point. It was therefore decided to conduct experiments on an additional piece of wire that was checked for integrity prior to investigation:
Wire 2, Set 1:
Wire 2, Set 2:
Averages for each wire were then calculated to give these results, which were then graphed:
GAP
Evaluation
As mentioned previously, the biggest downfall of the investigation was the apparent mistakes when choosing the wire, in that they would appear to be of differing diameters. This did not, in this case, cause a big problem as the same wire was used for each set of results so it is known that the results for each wire are correct.
Wire 1 would appear to contain the most accurate results due to the fact that all of its points bar one sit on the line of best fit for that wire. The only one that does not is the point at 90cm, which was exactly at the point that the black mark (mentioned previously) was found to be.
Wire 2, on the other hand, had three main anomalous results: at 50, 80, and 90cm. They are by no means that far off but in an experiment such as this, which is generally a very accurate one anyway, such anomalous results should not be quite so common. Possible explanations for these anomalies are as follows:
The length of wire for that particular measurement was not correct. At 50 and 80cm it is possible that the length was shorter, causing a lower resistance, and at 90cm it is possible that it was longer, causing a higher resistance. The solution to this is to measure the lengths more carefully and ensure that the wire is pulled tight against the metre rule.
For a particular result, one or more of the connections could have been faulty, causing extra resistance at the connections. A solution to this would be to, before each experiment, connect the connections together without the wire in place and measure the resistance then. If it is higher than it should be then the connections could be cleaned.
Whilst extremely unlikely, it is conceivable that the power supply was providing a different voltage for some of the results. This is unlikely to be a problem in this investigation but it might have been an issue had we used batteries instead.
NB: If one were to assume that Ohm’s Law applies, then another possible explanation could be that at some points (more likely in the lower lengths), the wire was not allowed to cool completely so that the temperature was higher for that measurement. Whilst unlikely (due to the two sets of results), this would cause a higher resistance as explained previously. However, it is now known, after researching the metal alloy “constantan,” that the resistivity (the electrical resistance of a conductor of particular area and length) of this alloy is not affected by temperature. Therefore, in these experiments Ohm’s Law does not apply.
SIXTH
The four factors that affect the resistance of a piece of wire:
- Length,
Diameter, or thickness,
- Temperature and
- The type of metal.
- From thinking about how I would do this investigation and the outcome of it, I decided to use the length of the wire as the variable.
GAP
Wire length: If the length of the wire is increased then the resistance will also increase as the electrons will have a longer distance to travel and so more collisions will occur. Due to this, the length increase should be directly proportional to the resistance increase. To measure and record the results for this factor is simple; the results would be collected and could show a connection between the length of the wire and the resistance given by the wire. This is why I have chosen to investigate how resistance changes with length.
Ohms law, V=I/R. This says that for a certain current (charge flowing at a certain rate), there will be a greater voltage across the wire if it has more resistance. This tells me that the voltage measures the amount of energy used up in getting each coulomb of charge through the wire. The units of volts are the same as joules per coulomb. Therefore, Ohms law says the more resistance means more energy used to pass through the wire. Resistance is a measure of how much energy is needed to push the current through something. The electrons carrying the charge are trying to move through the wire, but the wire is full of atoms that keep colliding in the way and making the electrons use more energy.
Preliminary Method
In this preliminary experiment, I will use different lengths of wires to measure their resistance. The main idea of doing the preliminary experiment was to find a suitable current number to put the power supply on. I also wanted to do this experiment to familiarise myself further with the method; if I had any problems I could correct them there and then. This would mean I would obtain precise and reliable results in my main experiment when investigating the connection between the length of the wire and the resistance of the wire. First, the circuit was set up as shown below. I had to be careful in connecting circuit, because the Voltmeter had to be placed in parallel and the ammeter, which had to be placed in series. Draw up a rough table onto a piece of paper with the appropriate headings. The wire was cut to just over 50cm so the crocodile clips could attach onto the wire, making the results more accurate. Stretch out the wire onto the bench and measure with a metre rule. The power supply was put on 2V and the gradually increased the 4V, to find a suitable current for my main method. The slider on the resistor was moved to allow me to do five repeats. I decided to go down in ten centimetre gaps, as it would allow me to lot a graph of resistance against length with a range of fie readings.
Results
As shown below there is only a range of five readings, which start to show a pattern, that the best fit line is directly proportional? To see if this trend carries on, I will widen my main experiment and use a 100cm length of wire, I will also take the readings every 5cm and not 10cm. From my experimentation with the power supply, I have decided to keep it at 4V, as I do not need the wire length to go lower than 10cm.
Main Experiment
Prediction
I predict that if the length increases then the resistance will also increase in proportional to the length. I think this because the longer the wire the more atoms and so the more likely the electrons are going to collide with the atoms. Therefore, if the length is doubled the resistance should also double. This is because if the length is doubled the number of atoms will also double resulting in twice the number of collisions slowing the electrons down and increasing the resistance. My graph should show that the Length is directly proportional to the resistance.
If the length of the wire is only half the length of the wire on the same type of wire, there should be half the number of collisions between the electrons and the atoms. If the wire is twice as long, there should be twice the number of atoms, resulting in twice as many collisions and a predicted doubling of the resistance.
Safety
Handle the power supply carefully. I am going to only use a voltage of four volts so the wire will not burn. Be careful when touching the wire, as it may be hot. Start on the lowest current, so the wire then will not melt or burn instantly. Be careful when the wire is connected, as it will get hot. Be careful when cutting the wire. Make sure the mains to the power supply are switched off when removing the wire from the circuit to be measured.
Apparatus
Power Supply,
Ammeter,
Voltmeter,
Just over 100cm of E26 Wire,
Meter Rule,
Two Crocodile Clips,
Connecting Wires.
Factors which must stay constant to keep the experiment a fair test:
- The power supply must stay on 4V,
- The wire must be the same thickness,
- The surrounding temperature must be constant,
- The equipment should be kept the same,
- The edge of the crocodile clips should be at the edges measured length.
The Variable factor
The factor that I am going to vary is the length of the E26 wire.
Circuit diagram
Method
The circuit was set up as shown above. A table was drawn out and the results were recorded. To improve the accuracy, compared to my preliminary results for my main Experiment, I have decided to set up the circuit with the metre rule sellotaped to the bench. This will make it easier and more precise as I will not have to keep on holding the wire then putting the crocodile clips on. I have chosen to use a meter ruler because the lengths that I will be measuring are to big for a smaller ruler and the meter ruler can be accurate to + 1mm. Make sure that the metre rule is actually one metre long and not one or two centimetres shorter. Next, move the crocodile clips down five centimetres rather than ten (as done in preliminary) each time to record the results. Use the E26 wire as it will also be easier to measure any change in resistance. To collect the data for my graph I have chosen to take a range 20 of lengths. I have chosen a range of 20 as to plot an accurate graph, I will need at 20 points to mark on the graph if I want to make precise and reliable results, to see if there are any patterns and trends. I have also chosen to take five repeats at each length and then take an average, to get reliable results. The lengths that I have chosen are as follows: 100cm, 95cm, 90cm, 85cm, and going down in fives to 10cm length of wire. I have chosen these lengths because they are easily measured by the meter ruler and give a good range of results.
As my preliminary results start to show a pattern in the readings (Resistance is directly proportional to length) to expand on my experiment and to see if this pattern continues, I am going to try the above lengths.
Results
To calculate the resistance of the wire, I shall use the equation below.
RESISTANCE = VOLTS/AMPS
Analysis
In my prediction, I stated that:
If the length increases than the resistance will also increase in direct proportion to the length. From my graph on the previous page, I can see that the resistance of the wire is directly proportional to the length of the wire. I know this because the Line of Best Fit is a straight line through the origin showing that if the length of the wire is increased then the resistance of the wire will also increase in proportion to each other. The line of best fit is a straight and it goes though (0,0) if there is no length, there is no resistance proving that the resistance of the wire is directly proportional to the length of the wire. This proves my prediction right. I can work out the gradient of this line by dividing the Resistance by the length. So, 1.75/55=0.0318
The length of the wire affects the resistance of the wire because the number of atoms in the wire increases or decreases as the length of the wire increases or decreases in proportion.
The resistance of a wire depends on the number of collisions the electrons have with the atoms of the material, so if there is a larger number of atoms there will be a larger number of collisions that will increase the resistance of the wire. If a length of a wire contains a certain number of atoms when that length is increased, the number of atoms will also increase.
If the wire is half the length of a certain wire, it would have has half the number of atoms, this means that the electrons will collide with the atoms half the amount of times. In addition, if the length of the wire was trebled or quadrupled, then the resistance would also treble or quadruple. This is indicated on my graph, with the length being 100cm and the resistance being 3.25 Ohms. This in theory would mean that at 50cm there would be a resistance of 1.63 Ohms. From the graph it is easy to tell that the theory is correct and therefore my results reliable. From my results table and graph, I can see that my results that I collected are quite reliable and accurate. I know this because my results table shows a few, individual anomalous results; the anomalous results are at lengths 95cm and 100cm. All the other points are extremely close to the line indicating that my results are accurate. I think that my results are suitable to confirm my prediction and support a conclusion. I know this because outside resources (Textbooks and Britannica) say that ‘the length increases in direct proportion to the resistance.´
SEVENTH
Aim
I am going to be studying the resistance of wire. The purpose of this investigation is to see how length and thickness of wire affect the dependent variable, resistance.
Prediction
I predict that, as the length of the wire doubles, the resistance will also double, but as the cross-sectional area of the wire doubles, the resistance halves. This means that the length will affect the resistance more than the thickness will.
Hypothesis
Electrons bumping into an ion causes resistance. If the length of the wire is doubled, the electrons bump into twice as many ions so there will be twice as much resistance. So if the cross-sectional area of the wire doubles there will be twice as many ions and twice as many electrons bumping into them, but also twice as many electrons getting through twice as many gaps. If there are twice as many electrons getting through, as there is twice the current, the resistance must have halved. This means that
I am assuming that the temperature is kept constant and that the material is kept constant. We can include this in our equations by adding a constant
Method
Equipment needed:
- 1 x Power Pack (to give varied voltage)
- 1 x Voltmeter
- 1 x Ammeter
- 5 x wires (with crocodile clips)
- Wire of varied length and thickness
- Controlled variables:
- Temperature (room temperature)
- Wire material
- Dependent variable:
- Resistance
- Independent variables:
- Thickness of wire
- Length of wire
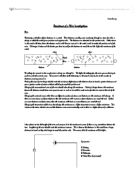
Circuit diagram
First, set up the experiment as shown above. Turn on the power and set the power pack so that the voltmeter reads 0.1 volts. Take the reading from the ammeter recording both the current and the voltage. Then do the same again but use voltages of 0.2 volts, 0.3 volts, 0.4 volts, and 0.5 volts. This is so that when we work out the resistance (V/I) we will have five readings and can then take an average resistance. Then carry out the whole thing again, varying the length of the wire in intervals of 10cm from 10cm to 100cm.
To do the thickness experiment, set up the equipment again as shown. Turn on the power and set the power pack to read 0.2 volts. Take the current reading then turn off the power and start again. Take four readings like this so that an average resistance can be found. Next, change the thickness of the wire and do the experiment again. Use the diameters 0.71mm, 0.56mm, 0.28 mm, and 0.20mm. Although the diameters haven't the same interval between them, once we have worked out the resistance, we can draw a graph to discover any relationship between the thickness and the resistance of wire.
EIGHTH
Introduction
Photosynthesis is the chemical process, which takes place in every green plant to produce food in the form of glucose. Plants use the suns energy to join together water and carbon molecules to make the glucose, which is sent around the plant to provide food. Cells in the root or stem can use the glucose to make energy, if the plant does not need to use all the glucose immediately then it is stored which is difficult because glucose is hard to store in water. Plants solve this problem by joining hundreds of glucose molecules together to make starch. Starch does not dissolve in water very well so it makes a better food store.
Photosynthesis takes place mainly in leaves and depends on an important green pigment called chlorophyll, which is found in chloroplasts. To obtain the most sunlight as possible, leaves have a large surface area and the more sunlight the plant receives, the better it can photosynthesise. Chloroplasts are found in palisade cells in large numbers and to allow as much light to get in as possible, the cells are arranged like a fence. This helps the energy entering the surface of the leaf to travel a long way through the palisade cells.
Glucose can provide energy or carbon, which can manufacture other molecules in the plant. Which can make new living matter and this is called biomass.
The chemical equation for photosynthesis is:
Carbon dioxide + Water = Glucose and Oxygen
6CO2 + 6H20 = C6H1206 + 6O2
Key Factors: CO2 is vital in photosynthesis because the plant takes in CO2 from the air and joins with water molecules to make glucose. The CO2 comes in through the stomata pores on the surface of the leaf and only 0.03 % of the air around is CO2 so it’s pretty scarce.
Temperature has to be kept at a certain level because if it gets too hot, about 45`C then the enzymes in the chlorophyll will be killed and photosynthesis will stop altogether. If the temperature is too cold then temperature becomes a limiting factor and the enzymes will stop working.
Light As chlorophyll uses light energy to perform photosynthesis; it can only do it as fast as the light is arriving. Chlorophyll only absorbs the red and blue ends of the visible spectrum but not the green light in the middle, which is reflected back. If the light level is raised the rate of photosynthesis will increase steadily but only to a certain point.
Water is important because it is needed to join with CO2 molecules to make glucose and the amount of chlorophyll needs to be enough so that the plant can photosynthesise to the best of its abilities.
Investigation
Prediction
I predict that the plastic sheets coloured green, yellow, and orange will produce the least amount of bubbles because the light will be transmitted. Whereas placing red and blue sheets in front of the Elodea will result in the greatest amount of bubbles because the light is absorbed. Certain colours of light can limit the rate of photosynthesis depending on how well it is absorbed into the plants chlorophyll to photosynthesise. In addition, the wavelength can change the rate of photosynthesis. If the lamp supplying heat for the plant were placed twice as far away, I predict that there would be half as many bubbles. In addition, if it were moved twice as far closer then there would be twice as many bubbles. This is backed up with knowledge from previous experiments and ones done by other people and scientific understanding.
Diagram
Previous experiment
Method
For our experiment we chose as accurate equipment as possible to give us the most accurate results. The equipment is as follows:
- 1 lamp A boiling tube
- A small piece of Elodea Plastic
- Sheets of different colours
- A beaker
The boiling tube was filled with water and the Elodea placed in. The boiling tube was placed in the beaker and the lamp placed at a set length away. He plastic sheets were individually wrapped around the beaker with an elastic band. For every new plastic sheet we counted the number of bubbles each time for a minute. It was important to keep the experiment the same each time to ensure it was fair test for example: The lamp stayed the same distance from the beaker, we used the same plant each time, and the plastic sheets were all the same size. The experiment was repeated three times and the results were averaged to ensure they were regular and as expected. Results were recorded each time and patterns observed. Previous results for an experiment of this kind have been recognized and compared. Throughout the experiment we observed for a number of distinctive things:
- Increase/Decrease in bubbles
- Temperature Increase/Decrease
- Change in Elodea
- Size of bubbles
Variables include:
- Length of Elodea
- Amount of water
- Distance of lamp
- Size of boiling tube
- Transparency of sheets
- Time spent counting
Changing either of the variables would have had effects on the results; we kept ours all the same each time to ensure a fair test.
Results
As predicted, the results conclude that using sheets with colours near the red and blue end of the spectrum produce a higher amount of bubbles than those near green. Thereby proving that photosynthesis is increased with certain colours of light.
Conclusion/Evaluation
In observation of the results, I have seen how the rate of photosynthesis in the Elodea has been affected by the various factors. In reference to the prediction, I was correct in that the red and blue coloured sheets produced the highest rate of photosynthesis, whereas the sheets, which were green and yellow, resulted in the least bubbles. I feel that we had taken enough measurements to be sure of a fair test as the experiment was repeated several times so. Each plastic coloured sheet we used had the same time, and variables as the others so we obtained precise results for every test. We did not find anything, which stood out too much from the pattern except that the red plastic sheet, when used resulted more bubbles generally than the blue sheet. This shows that chlorophyll absorbs red light more easily than blue. We acquired similar results with each repetition and found ours to be similar to previous experiments. The Elodea produced more bubbles with sheets at each end of the spectrum because the chlorophyll in the plant absorbs all the colours but transmits green. When the light is absorbed the plant converts it into energy to photosynthesise. The more light energy it receives the better and faster it can do this so when the sheets near the blue and red parts of the spectrum are held in front of the Elodea it absorbs the light and can photosynthesise better. If plastic sheets are held up which are have a colour near the green part of the spectrum then the light will be transmitted and the plant will not be able to photosynthesise as well. In this experiment we have covered the main colours of the visible spectrum and they are sufficient to produce the results that we are looking for.
If we were to repeat the experiment then there are several ways we could improve it. For example to get around the problem of the heat from the lamp producing more bubbles then a thick glass panel could be placed in the middle to prevent any heat reaching the Elodea. To improve the accuracy of counting the bubbles, you we could only count the ones, which are a certain size, and only the ones coming from the very end of the Elodea. If there were lots of people counting the bubbles and the results averaged then that would be a more accurate way of obtaining the information necessary. To extend the investigation you could change certain variables for example the type of plant that you are using to count the bubbles from. You could try an entire species of plant and see if the results are similar for every type. You could use different chemicals in the water each time to see which chemicals result in the greatest rate of photosynthesis.
NINTH
Aim
The aim of my experiment was to determine whether or not the intensity of light would affect the rate of photosynthesis in a plant. To do this, I placed a piece of Canadian pondweed in varying light intensities, and observed the amount of oxygen being given off. I used Canadian pondweed because of its unusual quality of giving off bubbles of gas from a cut end, when placed in water.
Introduction
Photosynthesis occurs only in the presence of light, and takes place in the chloroplasts of green plant cells. Photosynthesis can be defined as the production of simple sugars from carbon dioxide and water causing the release of sugar and oxygen. The chemical equation for photosynthesis can be expressed as:
(Light)
6CO2 + 6H2O A C6H12O6 + 6O2 (in the presence of chlorophyll)
The fact that all plants need light in order to photosynthesise has been proven many times in experiments, and so it is possible to say that without light, the plant would die. The reason that light intensity does affect the rate of photosynthesis is because as light, and therefore energy, falls on the chloroplasts in a leaf, the chlorophyll, which then makes the energy available for chemical reactions in the plant, traps it. Thus, as the amount of sunlight, or in this case light from a bulb, falls on the plant, more energy is absorbed, so more energy is available for the chemical reactions, and so more photosynthesis takes place in a given time. There are many factors, which affect the rate of photosynthesis, including light intensity, temperature, and carbon dioxide concentration. The maximum rate of photosynthesis will be constrained by a limiting factor. This factor will prevent the rate of photosynthesis from rising above a certain level, even if the other conditions needed for photosynthesis are improved. It will therefore be necessary to control these factors throughout the experiment so as not to let them affect the integrity of my investigation into the effect of light intensity.
Predictions
I predicted that as the intensity of light increased, so would the rate of photosynthesis. Furthermore, I hypothesised that if the light intensity increases, the rate of photosynthesis will increase at a proportional rate until a certain level is reached, and the rate of increase will then go down. Eventually, a level will be reached where an increase in light intensity will have no further effect on the rate of photosynthesis, as there will be another limiting factor, in this case probably temperature.
Preliminary work
Initially, to ascertain a suitable range of distances at which to record results for my experiment, I did a preliminary investigation in which I recorded the number of bubbles of oxygen given off in a given time at various light intensities. To alter the light intensity, I placed a lamp at various distances from the plant. I also therefore needed a way of accurately measuring the light intensity, and I did this using a photometer. I recorded the lux reading (unit of light intensity) at each distance. I got the following results:
Results of preliminary experiment
Although this is a very quick, simple and efficient way of obtaining an idea of the trends for the graph, and the boundaries for the measurements, this experiment was not in itself in my opinion accurate enough to be the basis of my main experiment. This lack of accuracy was mainly due to the fact that by simply counting the bubbles, I was relying on each bubble being exactly the same size, which they clearly were not. The preliminary experiment will, however, give me a best fit curve to which I can compare my main graph, and also points at either end of my results at which it is clear to see light intensity has little or no effect. Here, it was in fact at a light intensity of around 950 when it seems that another factor such as temperature or carbon dioxide concentration has become a limiting factor. In my main experiment therefore, it will not be necessary to take readings above this point. It also shows that while my outer limits are justified, it would be better to take more readings between the distances of 10 and 20 centimetres. As the distance between the points is large at this point, and so I have decided to take readings at the following distances: 5, 10, 12, 14, 16, 18, 20, 25, 30, 35, 40 and 45, cm’s.
Method
Input variables – light intensity is to be varied by increasing and decreasing the distance from the light source to the plant
Output variables – volume of oxygen produced (rate of photosynthesis) is to be measured by finding the volume of oxygen produced in a minute, and thus finding the rate of photosynthesis
Control variables –Light wavelength (colour) – light energy is absorbed by the pigment, chlorophyll, in the leaf. Chlorophyll easily absorbs blue light, in the 400-450 nm range, and easily absorbs red light, in the 650-700 nm range. However it does not easily absorb green or yellow light, rather it reflects them, decreasing the amount of light absorbed, and therefore the rate of photosynthesis. This can easily be controlled, simply by using the same lamp throughout the experiment.
Carbon dioxide concentration – This can affect the rate of photosynthesis, since if there is too little CO2, it can become the limiting factor, thus impeding the viability of the experiment. In this case, as long as the experiment is done over a short period of time, the amount of carbon dioxide used up by the plant will not be sufficient enough to cause the carbon dioxide concentration to become the limiting factor. If my experiment were to be performed over a longer period, for instance 24 hours, I would add a fixed amount of Sodium hydrogen carbonate to the water, thus ensuring a large enough supply of carbon dioxide.
Water availability – water is also required in the photosynthesis reaction, and when it is lacking, the plants’ stomata close to prevent further water loss. This closing of the stomata cells also leads to little carbon dioxide being able to diffuse through. Clearly, in a water plant, like the pondweed, as long as the plant is fully submerged in water at all times, this will not be a problem.
Temperature – Enzymes are used in the photosynthesis reactions of a plant. Therefore, temperature will increase the rate of photosynthesis, until a point at which the enzymes denature. Although performing the experiment at a temperature slightly higher than room temperature, perhaps 25°C, would have a positive effect on the accuracy of the readings I took, as it would reduce the percentage error, by increasing the volumes, I decided that the inaccuracy of maintaining a constant temperature would outweigh any advantages. I am therefore going to perform the experiment at room temperature, checking the temperature frequently, in case the heat given off from the light should slightly raise the temperature, in which case I shall simply refill the beaker with more water after each experiment.
Method
Cut a stem of Canadian pondweed of about 3cm in length. Fill a test-tube with pond water, and place it in a clamp, and then in a large beaker of cold water. Connect the end of the pondweed to the apparatus. Insert a thermometer into the beaker, and record the temperature at the beginning and end of each experiment, merely as a precaution against a significant rise in temperature, which is not expected. Set up a lamp at a set distance from the plant, ensuring that this distance is from the filament of the lamp to the actual pondweed, rather than the edge of the beaker. The light intensity was measured in the same way as described in the preliminary experiment, and assumed to be the same at any point at any particular distance. When bubbles are being produced at a steady rate, clear any previous bubbles from the tubing by moving the syringe. Start the stopwatch, and wait for 1 minute. Move the bubbles, which have been collected at the bend in the tubing to the part of the tube with a scale. Find the length of the bubble collected. Repeat for all other readings, and then repeat all readings a second time to get an average result for each distance.
Apparatus list
- Desk lamp
- Apparatus
- Canadian pondweed
- Knife
- Clamp
- Pond water
- Thermometer
- Test-tube
- Beaker
- Cold water
- Stopwatch
Using the described method, I found the following results:
Results for main experiment
Although, because I was using light intensity as my variable, I did not need to record the distances as well, I did, simply to use them as a marker for each result, so that I only had to record the light intensity once at the beginning. From then I just had to align the lamp at the correct distance each time.
Analysis
My graph was in the form of a best-fit curve. I drew it as a curve rather than a straight line because of the clear pattern of the points. This meant that the rate of photosynthesis increased as the light intensity increased. This was because photosynthesis is a reaction, which needs energy from light to work, so as the amount of energy available from light increased with the rise in light intensity, so did the amount of oxygen produced as a product of photosynthesis.
My graphs showed that the relationship between the light intensity and the rate of photosynthesis was non-linear, as both graphs produced a best-fit curve. However, as I expected in my hypothesis, it does appear that for the very first part of the graph, the increase in rate is in fact proportional to the increase in light intensity (i.e. a straight line) and I can show this by taking some readings from the graph:
From these results, I am able to say that an increase in light intensity does certainly increase the rate of photosynthesis. The gradual decrease in the rate of increase of the rate of photosynthesis (the shallowing of the curve) can be attributed to the other factors limiting the rate of photosynthesis. As light intensity increases, the photosynthetic rate is being limited by certain factors, such as carbon dioxide and temperature. These factors do not immediately limit the rate of photosynthesis, but rather gradually. As light intensity increases further, so the rate of photosynthesis is being limited by other factors more and more, until the rate of photosynthesis is constant, and so is almost certainly limited in full by another factor.
Overall, both graphs and my results support my predictions fully. My idea that the rate of photosynthesis would increase with light intensity was comprehensively backed up by my results. This is because a higher light intensity involves a greater level of light energy, which can then be transferred to a special protein environment designed to convert the energy. Here, the energy of a photon is used to transfer electrons from one chlorophyll pigment to the next. When enough energy has been gathered at a reaction centre, ATP can be synthesised from ADP. The oxygen collected in the experiment is in fact the by-product of this reaction, and so it is clear to see that the more light energy, the more ADP is being converted into ATP and more oxygen is produced as a result.
Evaluation
Although I feel that my experiment was sound overall, I thought there were many points at which the accuracy was not perfect. As I have already stated, my preliminary experiment was not accurate enough to justify being used as my main experiment, mostly due to the fact that I was relying on all the bubbles being the same size, which they clearly weren’t, however many of the smaller inaccuracies also apply to my main experiment.
Firstly, the distance between the light sources and the Canadian Pondweed were not measured to a very high degree of accuracy, especially when you note the fact that the distance should have been measured exactly from the filament of the light bulb to the centre of the plant, and it is possible here to find a percentage error. I estimate that the error could have been up to 0.5cm and I will find the percentage error for the largest and smallest reading using this estimate:
Percentage error = possible inaccuracy
Total reading
% Error distance
10 5cm
1 50cm
It is clear to see that the percentage error is much less for the larger distances. Although I was not actually using the distances as part of my results, I used them as a marker for where the lamp was placed each time, as I assumed that the light intensity would be the same each time at a particular distance. Therefore, any inaccuracies in measuring the distances, i.e. if a distance was slightly different when doing the actual experiment from the distance at which I earlier measured the light intensity, an error would ensue.
The second major inaccuracy was in measuring the volume of oxygen given off. When reading the syringe there could have been an error of 0.25mm, and again it is possible to find a percentage error.
% Error volume
3.57 7ml
50 0.5ml
For the smallest volumes this is clearly a massive error, and to improve this, it would be necessary to do the readings over a longer period, therefore increasing the volumes, and in turn reducing the percentage errors.
Another error would have been due to background light in the vicinity. We tried to reduce this error by closing all blinds in the laboratory, but due to practical reasons, we could not all perform the experiment in a separate room, and we therefore experienced light pollution from other student’s experiments. This would have had a very marginal effect on my results as a whole, but to eliminate this problem, it would have been necessary to perform the experiment in a totally dark room.
A further inaccuracy was in the heat generated by the lamp. As I have earlier described, temperature has a very noticeable effect on the rate of photosynthesis, and so any increase in the temperature of the pond water would have had serious effects on the accuracy of my results. To ensure this did not happen, I monitored the temperature of the water before and after every reading, to check that the temperature did in fact not rise. It turned out not to be a problem, as over the short period taken by my experimental readings, the temperature did not rise at all. However, if I were to extend the time of my experiment to 5 minutes for each reading for example, which would have the effect of reducing other percentage errors, I would have to find some way of keeping the temperature constant. One way of doing this would be to place a Perspex block between the lamp and the plant, which would absorb most of the heat, while allowing the light energy to pass through.
As I mentioned in my planning, carbon dioxide concentration could have been an error in the experiment, however, I feel that due to the short period of time taken, there is very little chance that the concentration would ever have been so low as to have become the limiting factor. Again if I were to carry out the experiment over a longer time, it would have been necessary to add sodium hydrogen carbonate to the water to increase the carbon dioxide concentrations.
The last inaccuracy, though a small one, was in the time keeping. The main problem here was in when to begin the minute. If for one reading, the minute was started just after one bubble had been produced, and in another reading it was just before, this could have had a negative effect on the accuracy of my results. I therefore ensured that in each case I started the stopwatch just after a bubble had been produced, thus heightening the accuracy.
Overall, I felt that due to the small volumes of oxygen involved, my experiment was not as accurate as it could have been, however I believe it was accurate enough to support and justify my hypotheses. Improvements could have been made as I have stated, mainly by simply increasing the time taken. However, due to practical time constraints in taking the readings for my investigation, and some consequential problems relating to time extension, I could not in fact make these adjustments. The other obvious way of increasing the reliability of my results would be to take many repeat readings and find an average.
To extend my enquiries into the rate of photosynthesis, I could perhaps try to link in some of the other limiting factors to the same experiment, as well as investigating them in their own right. It could also be interesting to explore the effects of coloured lights on the rate of photosynthesis, which could lead to the question of whether or not other types of light, such as fluorescent lights or halogen lights, would have a different effect on the rate of photosynthesis.
TENTH
PHOTOSYNTHESIS INFORMATION:
The Nature of Light
Light behaves both as a wave phenomenon and as discrete particles of energy called photons. If we look at light as a wave phenomenon, we can assign it a wavelength (the distance from one peak of the wave to the next) and an amplitude (the distance the wave oscillates from its centreline). Different wavelengths of light have different characteristic energies and properties. Light can also travel at various speeds in different media, producing a frequency at which the wave travels. The energy contained in a wave of light is related to its frequency.
Where E is energy, h is Planck's constant Energy = (6.626196 * 10^-34 Joule-seconds), and c is the speed of light. Short wavelengths have high energies and long wavelengths have lower energies.
Pigments
How do living things capture light? Molecules, when struck by a wave or photon of light, reflect some of its energy backs out, or it can absorb the energy, and thus enter into a higher energy or excited state. Each molecule absorbs or reflects its own characteristic wavelengths of light. Molecules that have evolved to absorb wavelengths in the visible region of the spectrum very well are called pigments. Absorption and Action Spectra An absorption spectrum for a particular pigment describes the wavelengths at which it can absorb light and enter into an excited state. The following diagram represents the absorption spectrum of pure chlorophylls in solution:
An action spectrum, on the other hand, describes the efficiency of a particular molecule at achieving its purpose in absorbing light; this measurement shows what wavelengths of light the molecule can trap to conduct photosynthesis. In addition, action spectrum closely follows an absorption spectrum for a particular pigment because the molecule has to be able to absorb light to enter into its excited state and pass the energy along.
Chlorophylls and the Accessory Pigments Chlorophyll is a generic name for green pigments in plant cells....a substance that absorbs visible light primarily in the red, violet and blue regions of the light spectrum. There are several kinds of chlorophyll with chlorophyll a being the most important for light dependent reactions in the complex photosynthesis processes. Chlorophyll a and b exist in plastids in cells of higher plants while chlorophyll c, d, and e are present only in algae. Photosynthesis is the process of converting light energy into chemical energy which can only be performed by plants. All life on earth depends upon the ability of plants to photosynthesise simple sugars which are the basic source of food from which all other forms of food originate. A chlorophyll molecule is made up of carbon and nitrogen atoms joined in a complex ring with an atom of magnesium located in the centre of the ring. The molecule has a long chain of 20 carbon atoms making up an alcohol "tail" attached to the ring. Each kind of chlorophyll may vary somewhat in its molecular structure giving it slightly different chemical and physical properties.
Chlorophyll appears to have three functions:
It serves as antennae to absorb light energy. In this process it becomes "excited" (it produces electrons that exist beyond their normal "ground" state and are in a "charged” condition, so to speak, ready to move elsewhere as a source of electrical energy.
Chlorophyll transfers H+ electrons by a process known as resonance transfer across thylakoid membranes to P700 and P680 type chlorophyll a molecules.
Chlorophyll, with the aid of enzymes, converts light energy into chemical energy by a complex series of processes of oxidation involving loss of electrons. In these processes carbon dioxide and water are converted to glucose and oxygen.
ELEVENTH
Aim: To investigate a factor that affects the rate of photosynthesis.
Outline: A piece of pondweed will be cut and placed into a beaker containing water and sodium hydrogen carbonate. A lamp will be shined on to the pondweed and the amount of bubbles released from the plant will be counted. The lamp will be adjusted to different distances from the plant to try and obtain different results.
Photosynthesis Equation:
6CO2 + 6H2O light energy & chlorophyll C6H12O6 + 6O2
Variables:
Experimental Variable- Light intensity is to be the variable explored in this investigation. Increasing or decreasing the distance from the light source to the plant can vary light intensity.
Fixed Variables-
Light Wavelength (colour)- Light energy is absorbed by pigments in the leaf such as chlorophyll. Chlorophyll easily absorbs blue light, in the 400-450 nm range, and easily absorbs red light in the 650-700 nm range. Chlorophyll does not absorb green light or yellow light effectively but tends to reflect them, decreasing the amount of light absorbed and decreasing the rate of photosynthesis. Why the rate of photosynthesis increases or decreased from the amount of light energy absorbed is what is being investigated in this experiment. The light colour can be fixed by using the same lamp throughout the experiment.
Carbon Dioxide- CO2 concentration can affect the rate of photosynthesis since the more CO2 in the air, the more CO2 that can diffuse into the leaf. This variable can be fixed by adding a fixed amount of sodium hydrogen carbonate to the beaker and plant. The experiment should also be completed in one session and under two hours so the plant does not use up a significant percentage of the CO2.
Water- Water is required in the photosynthetic reaction. When plants lack water, their stomata close to prevent further water loss. At the same time, closing the stomata cells doesn't allow CO2 to diffuse into the leaf. Water is also therefore, linked to the carbon dioxide factor. Water can be kept a constant by keeping the same amount of water in the beaker.
Temperature- Enzymes are used in photosynthesis and the respiration of the plant. Therefore, increasing the temperature will increase enzyme reaction and the photosynthetic rate until a certain point is reached when the enzymes denature. The temperature can be kept somewhat a constant by performing the experiment in one session, when the air temperature shouldn't change enough to affect water temperature. A transparent glass block will also be placed in front of the lamp to retain some of the heat from the lamp.
Plant- Different species plants have different photosynthetic rates due to the different leaf structures of the plants. Even plants of the same species may have slightly different rates of photosynthesis since there may be more or less chlorophyll in the leaves to absorb light. The size of the plant is also important since this would affect the amount of surface area for gas exchange. The only solution to controlling this variable is by using the same plant throughout the experiment.
Limiting Factors- Light, carbon dioxide, temperature, and chlorophyll are all limiting factors, meaning that even when there is surplus of every other variable, the rate of photosynthesis will be limited by the limiting factor until there is an optimal amount of the limiting factor to increase the rate of photosynthesis further. Otherwise, the rate of photosynthesis can no longer increase.
Prediction: I predict that increasing the light intensity will increase the rate of photosynthesis at a proportional rate where LI is inversely proportional to 1/d2 when LI= light intensity and d= distance (from light source to plant). This is true to a certain point until another factor is limiting the rate of photosynthesis.
Hypothesis: When chlorophyll absorbs light energy, the light energy cannot be immediately used for energy conversion. Instead the light energy is transferred to a special protein environment where energy conversion occurs. This happens by using the energy of a photon to transfer electrons from a chlorophyll pigment to the next. When enough light energy has been harnessed at a reaction centre, ATP can be synthesized from ADP. During this reaction, oxygen is produced as a by-product and it is the oxygen bubbles that are being measured in the experiment. The greater the light intensity, the more light energy that can be transferred and harnessed to fuel reaction in photosynthesis.
Light intensity is inversely proportional to the distance squared because the light energy spreads out as it travels further and further from its source. Light energy travels along the circumference of an expanding circle. When light energy is released from a point, the energy is dispersed equally along the circumference. However, since the circle is expanding, the circumference increases and the same light energy is distributed along a greater surface.
Method:
Set up the apparatus as shown in the diagram above but leaving out the pondweed, funnel, test tube, water, and the sodium hydrogen carbonate. Fill the beaker with 450 cm3 of water and 50 cm3 of NaHCO3. Select 1 or 2 pieces of pondweed each roughly 5-10 cm long and cut off the stems. Place the pondweed in the beaker and secure the funnel upside down over (on top of) the pondweed using the plaster sine. Place a water-filled test tube upside down and over the funnel (see diagram). Place the ruler so that the "0" measurement is aligned with the side of the beaker. (Distance measured from side of beaker to edge of light bulb) Place the lamp directly in front of the plant so that it is 0 cm away from the beaker. 8.) With the light shining on the plant, record the number of bubbles emitted in a 1 minute duration. Switch off the lamp and wait for another minute before taking another reading. Take 3 readings at the current distance and move the lamp 5 cm further away from the plant. Repeat steps 8 and 9 until 3 readings from at least 5 intervals of 5 cm have been taken. Proceed to the data analysis stage.
Conclusion:
From the results that I have gathered I can state that an increase in light intensity certainly does increase the rate of photosynthesis. As was also expected in my prediction, the relationship between light intensity and the rate of photosynthesis was non-linear. From both graphs there is a best-fit curved line. This means that the rate of photosynthesis increases at an exponential rate.
However, my prediction that light intensity is inversely proportional to the distance squared did not fit into my results perfectly. The rule existed but there was often quite a large margin of error.
When measuring light intensity in terms of distance, the greater the distance, the slower the rate of photosynthesis. While the rate of photosynthesis was decreasing, the rate at which it was decreasing at was also decelerating. This is where the line in graph 1 swallowed.
When measuring the light intensity in terms of LUC, the greater the distance, and the slower the greater the rate of photosynthesis. While the photosynthetic rate increased, the rate at which it increased was decreasing. This is where the line in graph 2 shallows.
The swallowing of the line in graph 1 can be explained by the fact that light intensity is inversely proportional to the distance squared. This means that as distance increases the light intensity decreases at an exponential rate. If light intensity decreases exponentially, photosynthetic rates that depend on light intensity also decreases exponentially. The line in graph 1 would eventually reach "0" where photosynthesis stops as light intensity limits this rate.
The swallowing of the line in graph 2 is due to other factors limiting the rate of photosynthesis. These other factors do not immediately limit the rate of photosynthesis but rather gradually. As light intensity increases the photosynthetic rate is being limited by certain factors such as carbon dioxide and temperature. As light intensity increases further, these factors limit the rate of photosynthesis even more until photosynthesis is completely limited and the graphed line become horizontal. This is when photosynthesis is being carried out at a constant rate.
The reason that a "f 1/b2 did not apply was due to the apparatus used. The lamp that I used had a cover that directed the light energy somewhat. The light energy did not spread out as much as a plain light bulb with no cover. The distribution of the light energy was more concentrated, changing the gradient of the graph.
Evaluation:
Overall, I would state the experiment as a success since my predictions were supported by my results. This is important in reflecting success only if my prediction was sensible and logical. Just as important is where the experiment was not a success and why. This photosynthesis investigation was probably not performed as accurately as it could have been due to some controllable and uncontrollable conditions. Some mistakes can be corrected.
While performing the experiment, the piece of pondweed did not photosynthesise at a steady rate, even when the distance from the plant to the light source was kept a constant. The second reading at 0 cm was far greater than the first reading at 0 cm. While the number of oxygen bubbles was being recorded, the rate at which the plant was photosynthesising had increased several times. This may be due to the poor circulation of sodium hydrogen carbonate at the beginning of the experiment. Carbon dioxide may have initially limited the rate of photosynthesis. The readings at 0 cm and 5 cm were repeated many times until the rate of photosynthesis had begun to settle. From then on, there were no more similar problems during the experiment. To make sure that the there the negative effects from this problem may be inaccurate data for some readings. These would show up on my graph. However, there seemed to be few anomalies than was expected when the experiment was being performed. Almost all readings were in correlation with each other and all of the anomalies were in the high photosynthetic rate end of the results. This was when the distance from plant to light source was 0 cm or only 5 cm. A large factor in determining data accuracy is the amount of human error during experiments. The rate at which oxygen bubbles were being produced by my plant was so high that I found it difficult to count the amount of bubbles. I estimate a margin of error of at least 3 bubbles for each reading taken. To improve the accuracy of the results, the readings would have to be taken several more times. The entire experiment could have been performed again, and the new results could be combined if the same plant is used. However, the photosynthetic rate of the same piece of pondweed would eventually decrease over time anyway. Repetitions would, however, improve the overall reliability of the results.
Quite a few factors could affect the results of my experiment. Some of these are variables that were mentioned earlier and could not be controlled, or they were variables that were not initially considered. While performing the experiment, some of the oxygen produced from photosynthesis may have dissolved into the water. Microorganisms living on the pondweed may have even used some oxygen. The amount of oxygen dissolved or used by microbes is probably insignificant to my results since the degree of accuracy at which I measured was not high enough. Some oxygen is also used during the respiration of the plant. However, since only bubbles were counted, the volume of bubbles was not as important. However, to volume of oxygen produced is important, since it was volume in terms of bubbles that were measured. As the rate of photosynthesis decreased due to a decrease in light intensity, the size of the bubbles produced also became smaller. This change in bubble size was no accounted for when the results were analysed. For a more accurate analysis of the collected data, volume should have been measured instead of bubble quantity since the size of bubbles can vary. Using a capillary tube in place of the test tube so that the volume of each bubble could have been measured could have done this.
During the high intensities I had experienced counting difficulties of the bubbles being produced. There are also factors affecting accuracy at low light intensities. With low light intensity, the pondweed receives some light energy from background light such as sunlight seeping through curtains or the light from the lamp of another student's experiment. To eliminate most all background light, the experiment must be performed in a completely dark room. Even then, some of the light from the lamp in my experiment would reflect of the table and reach the plant though this amount of light is probably insignificant in affecting the rate of photosynthesis.
Temperature was also another factor that was controlled by the lamp being used. Even though a glass block was used in front of the lamp to prevent some heat from reaching the plant, not all the heat can be blocked. The extra heat, however, did not affect the temperature of the water, which stayed at between 290 and 300 C.
The method of the experiment could probably also be improved to obtain more reliable results. As already mentioned, the a capillary tube should be used in place of a test tube to accurately measure the volume of the oxygen produced. Due to the high rates of photosynthesis of the pondweed, readings should be taken within shorter times. I had originally chosen to count the number of bubbles in one minute but this produced miscounts in the readings. If during a repeated experiment, counting bubbles is still used, there is a smaller chance for human error when counting within a smaller time frame. If the capillary tube option was to be chosen, volume should be measured for a smaller time frame to reduce the overall time to complete the experiment. In addition, during high rates of photosynthesis, it would still be difficult and impractical to measure the volume of oxygen produced for a long duration.
Due to the nature and convenience of the experiment, it could be easily modified to investigate another variable of photosynthesis. Since sodium hydrogen carbonate (NaHCO3) is used to provide the pondweed with carbon dioxide. Performing the experiment with different volumes of NaHCO3 could vary the amount of CO2. The plant would be kept at a constant distance from the lamp and a constant volume of water would be added to the sodium hydrogen carbonate. Another experiment using almost identical apparatus would be to vary the colour of the light the plant absorbs. Using translucent colour filters in front the lamps could vary this. Since light wavelength has already been identified as a variable of photosynthesis, it would be interesting to actually test it. The only problem of this experiment is that there is no way to define or "measure" the colour of light. Wavelength would be a solution but this cannot be measured with available equipment. We only have a general idea of how to class colours. Because of this, the coloured light experiment should not be taken as seriously as light intensity or carbon dioxide.
TWELFTH
In this coursework, I intend to explain the variation (if any) that light intensity makes to the rate of photosynthesis in a green plant. To do this, I will be measuring the rate of photosynthesis of elodea, a Canadian water plant, under different levels of light intensity.
Photosynthesis is an organic chemical reaction which green plants use to produce glucose from carbon dioxide and water. Its equation is
6CO2 + 6H20 C6H12O6 + 6O2
However, carbon dioxide and water cannot react on their own “They have to be given energy to make them combine. The energy which green plants use for this is sunlight energy.” We can determine that if sunlight gives the reaction energy, and increase in the intensity of the sunlight will give the reaction more energy, which will speed the reaction up. We can therefore safely predict that as the intensity of the light increases, so too wills the speed of the reaction.
- Oxygen bubbles
- Beaker
- Lamp
- Water + Elodea
- Sodium Hydrogen
- Carbonate
I can use the products of the reaction to measure the rate of photosynthesis in the elodea. The most available product I can measure is oxygen, which is expelled from the end of the plant as it is produced, and so I shall therefore be measuring this. To photosynthesise the plant takes CO2 from the water, as carbon dioxide dissolves from the air into water, but the amounts of CO2 in the water are too small to produce a quick reaction. To remedy this, I will be adding NaHCO3 to the water. This breaks down to leave CO2 (aq). Throughout the experiment, I used constant amounts of NaHCO3, water, and elodea to ensure fair testing. I used 300ml water, adding the 0.2g NaHCO3 before the elodea, of which I used 7.5cm (I measured it in length as if I had weighed it the weight of the stalk could vary, causing me to use a shorter length which would decrease the amount of chlorophyll being included in the experiment). To change the light intensity, I used a lamp. Varying the distance of the lamp from the beaker changes the intensity of the light because the further a beam of light travels, the wider the beam becomes, so when the beam hits a surface, the light is spread over a larger area than it would be if it hit a closer surface. The more spread out the light is, the less intense it is, and so moving a lamp closer to the elodea increased the light intensity. To ensure I obtained an accurate set of results, I did the experiment three times and found the average. In addition, as a point of reference, I did a control experiment; all the environmental factors were the same, except for the control I did not use a lamp. This served to eliminate a possibility of background light interfering in the experiment; the control marked the point at which the background light had become more influential than the light from the lamp. To measure the rate of photosynthesis, I counted the frequency of bubbles being expelled from the stalk of the elodea in a 60 second time.
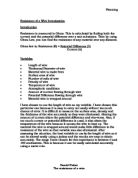
On looking at my graph, I can see that I was partially correct in my prediction. As the light intensity goes up, so too does the rate of photosynthesis, but after the light intensity reaches about 0.03, the graph begins to curve and level off until it becomes totally horizontal. As I have said, the sunlight gives the reactants the energy to react, but sunlight alone cannot make carbon dioxide and water react; it needs to be directed at the reaction. This job is done by chlorophyll. The sunlight travels through the transparent epidermal cells to a palisade cell, in which is a chloroplast. In the chloroplast there are stacks of membranes covered with chlorophyll (see picture below). This chlorophyll absorbs the energy from the sunlight. With the help of this sunlight and the enzymes in the chloroplast, the CO2 and H2O can react. The chlorophyll can only absorb up to a certain amount of light, and so when the light intensity reaches a certain point, any increase in light intensity after that point does not affect the reaction; it stops being a limiting factor.
A Chloroplast
While doing the experiment thrice contributed to the accuracy of the experiment, there were factors that detracted from it. The method of measuring the rate of photosynthesis by the frequency of bubbles was one. The volume of the bubbles could have varied, meaning that a larger or smaller amount of oxygen could have been released without being recorded. Also, the distance between the light source and the beaker could have been slightly longer or shorter than was recorded, making the light intensity less or more than was expected. To remedy these things, I could have used apparatus like a micro-burette or some other tool for measuring small volumes of gas. This would make the results more accurate. To correct the problem of inaccurate distance measurements, a variable wattage lamp could be used so that as the wattage increases or decreases so to does the light intensity. These inaccuracies however do not seem to have affected the results, as can be seen from the shape of the graph.
Other experiments in this area could include testing the rate of photosynthesis under different temperatures, as the sun could be giving the plant heat as well as light as an energy source; testing the rate of photosynthesis with different water to CO2 ratios; and also testing the rate of photosynthesis with different amounts of chlorophyll in the plants.