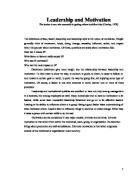
The Physiological Needs: These are the most bodily basic needs as (food, clothing, shelter, and comfort); these physiological needs might serve as channels for all sorts of other needs as well (Adair, 1990). When someone becomes in need for food and water, then the desire to eat and drink become dominant and all other needs tends to be swept away, when the physiological needs are relatively well satisfied, a new set of needs emerges centered upon the safety of the organism (Adair 1990).
The Safety Needs: These include the need to feel secure and protected from any physical or emotional harm, individuals are afraid for their existence. The safety need may be in the form of many procedures or regulations such as security of tenure, pension, and insurance schemes or the improvement of safety conditions at work, also the problem for the known rather than the unknown.
The Social Needs: When the physiological and safety needs are met, the needs for love and friendship and belongingness emerge as the dominant center of motivation (Adair, 1990). He primarily relates these needs to the acceptance of the individual, once the social needs are met, the esteem needs emerge.
The Esteem Needs: Those needs are related to one’s having positive self-image; Maslow divided them into two main sets:
• The desire for achievement, competence, independence and strength.
• The desire for status, reputation, recognition, attention and appreciation.
The most stable and therefore most healthy self-esteem is based on deserved respect from others rather than an external fame or celebrity and unwarranted adulation (Adair, 1990).
The Self-Actualization Needs: The highest need category as the individual is concerned primarily of becoming all that he is possible to become, reaching potential, independence, creativity, and self-expression. Maslow also contends that achievement of these goals is not as important as attempting them. He also discussed two additional needs: cognitive and aesthetic. Cognitive needs are the needs to know and understand as the desire to learn, where as aesthetic needs is the desire to move towards beauty and away from ugliness. These two needs are not included in Maslow’s hierarchical arrangement or any other discussion of his concepts (Adair, 1990).
Theory X & Theory Y by McGregor
Douglas McGregor worked as a social psychologist and studied human nature and human behavior, after working as a management consultant. McGregor developed two distinct theories explaining the way managers' deal with employees and their assumptions towards the nature of human being.
Theory X: Represents the traditional view of direction and control, it consists of: Human being inherently dislikes work, and whenever possible tries to avoid. Because of their hate to work, most of them must be controlled, coerced, and directed and even threatened with punishment in order to achieve organizational goals adequately. Human being wants security above all, always avoids responsibility and have little ambition.
Theory Y: The integration of individual and organizational goal, it consists of: The human beings view work as natural as play or rest. Punishment is no longer the only mean to achieve organizational objectives; man will exercise self-control and self-direction in order to achieve the objectives he/she committed to. Commitment to objectives is a function of the rewards associated with their achievement. The average human being learns to accept and seek responsibility.
Due to the conditions of modern industrial life, intellectual potentialities of the average human being are partially utilized. The capacity to exercise a relatively high degree of innovation and creativity in the solution of organizational problems is widely distributed in the population. In this theory, McGregor had overcome Maslow’s theory of hierarchy of needs, but he explained it into a language, which industrial and commercial managers could understand. He integrated the theory with the more traditional concerns of management by suggesting that the needs of the individuals and the needs of the organization were not naturally mismatched (Adair, 1990). Because of this theory, McGregor suggested a participative decision making environment, friendly social relations at work and challenging job, all these would enhance employees’ job motivation (Adair, 1990).
Herzberg’s Motivation Hygiene Theory
Frederick Herzberg was a professor of Psychology, whom conducted a research to determine the factors of individuals' success or failure at work, he performed studies to determine which factors in an employee's work environment caused satisfaction or dissatisfaction. He published his findings in the 1959 book The Motivation to Work. The studies included interviews in which employees where asked what pleased and displeased them about their work. Herzberg found that the factors causing job satisfaction (and presumably motivation) were different from that causing job dissatisfaction. He developed the motivation-hygiene theory to explain these results. He called the satisfiers motivators and the dissatisfies hygiene factors, using the term "hygiene" in the sense that they are considered maintenance factors that are necessary to avoid dissatisfaction but that by themselves do not provide satisfaction (Herzberg, Mausner, & Snyderman, 1959). The following presents the top six factors causing dissatisfaction listed in the order of higher to lower importance.
- Company policy
- Supervision
- Relationship w/Boss
- Work conditions
- Salary
- Relationship w/Peers
And the top six factors causing satisfaction, listed in the order of higher to lower importance are:
- Rewards.
- Decision involvement.
- Age.
- Position.
- Recognition.
- Work itself.
Vroom's Expectancy Theory
Expectancy theory is one of the contemporary theories, was formulated by psychologist Victor Vroom, Vroom’s theory is based on the belief that employee effort will lead to performance and performance will lead to rewards (Vroom, 1964). Rewards may be either positive or negative. The more positive the reward the more likely the employee will be highly motivated. Conversely, the more negative the reward the less likely the employee will be motivated. It assumes that to motivate someone, it is not enough to offer the person something to satisfy his important needs. The reason for that is that in order for the person to be motivated, he must also be reasonably sure that he has the ability to obtain the reward. According to Vroom for motivation to take place, two conditions have to occur - The value of particular outcome (such as becoming personnel manager) must be high for the person. (Vroom, 1964). The person must feel he has a reasonably good chance of accomplishing the task and obtaining the outcome. That is, the person must be convicted that effort will be instrumental (or helpful) in obtaining the reward. (Vroom, 1964). Motivation increases when an employee values a particular outcome highly and when feels a reasonably good chance of achieving the desired goal. Any individual acts in a way to reach a maximal effect with a minimal effort.
Adams' Equity Theory
John Adams, a behavioral psychologist, put forward his Equity Theory on job motivation in 1963. Adams' theory states that employees endeavor for equity between themselves and other workers. Equity is achieved when the ratio of employee outcomes over inputs is equal to other employee outcomes over inputs (Adams, 1965). Employees' seek a fair balance between what they put into the job and what they get out of it. Adams calls these inputs and outputs (Adams, 1965). A perception of what constitutes a fair balance of inputs and outputs is formed, by comparing the situation with others in the market place. Colleagues, friends, partners in establishing these benchmarks also influence employees' and their own responses to them in relation to their own ratio of inputs to outputs (Adair, 1990). If an employee feels that inputs out-weigh the outputs then he/she becomes demotivated in relation to the job and to the employer. People respond to this feeling in different ways: Some people reduce effort and application and become silently dissatisfied or externally difficult, or even disruptive. Other people seek to improve the outputs by making claims or demands for more reward, or seeking an alternative job (Adams, 1965).
1.4 Problem Statement
After the meeting with the human resource manger we agreed that the main objective is to measure the motivation level for the employees and to determine the variables that influence it, so the problem statement is as follow:
“How can we increase the motivation level of the employees?”
Chapter Tow
2.1 Theoretical framework
After reviewing the different theories and researches in the literature review above, it was concluded that the dependent variable is the Motivation of the employees which is the variable of main interest in this research, and it is variance is to be explained by the four independent variables of (1) Rewards, (2) Decision involvement, (3) Age, (4) and position
The literature review pointed out that there is a relation between the motivation of the employees and the rewards; the higher the rewards that an employee would get the higher the motivation will be. The same thing is true for Decision involvement, which means that higher Decision involvement from his supervisor means a higher motivation for the employee. On the other hand, younger employees have higher motivation from older employees. Finally the position of the employee affects the degree of motivation he has; which means that administrative employees and employees in challenging jobs have higher motivation than employees in service jobs. These relationships are illustrated in the following diagram:
Independent Variables Dependent Variable
2.2 Hypothesis
The following hypothesis was stated based on the aims of this study:
Null Hypothesis:
H0: the four independent variables together (Rewards, Decision involvement, Age, and position) have no effect on the Dependent Variable (Motivation).
- H0: ρ = 0 : Where ρ = correlation between the independent variables and dependent variable.
Alternate Hypothesis
Ha: the four independent variables together (Rewards, Decision involvement, Age, and position) have effect on the Dependent Variable (Motivation).
- Ha: ρ ≠ 0 : Where ρ = correlation between the independent variables and dependent variable.
This research will test this hypothesis by applying the Regression technique using the Enter methods.
Chapter Three
Research Methodology
3.1 Research Design
We will talk in this part about the steps being followed to accomplish our study, the tools we used to collect the needed data, and the sample we picked and how we chose it.
3.1.1 Type and nature of the study
The aim of this study is to find the correlation relationship between the dependent variable (Motivation) and the independent ones (Rewards, decision involvement, Age, and Postion). Our study will be a field study with uncontrived settings and the data will be collected in the field using a designed questionnaire.
3.2 Sampling:
3.2.1 Target Population:
The target population in our research is all the employees who work at JAWWAL Company in West bank and Gaza strip and they are according to the companies files exactly 1000 employees.
3.2.2 Sample Population:
The sample population is the employees who work at Ramallah main office. And according to the companies records are 412 employees.
3.2.3 Sample Size:
Many factors affected the sample size but the most important factor was the limited time for the research which is 10 days. The other important factor was the limited budget for this research.
For the main two reasons above, we decided to take 30 employees as a sample size, and to build the research upon them, with confidence degree of 95%.
3.2.4 The Sample Design
In designing our research sample, we took into consideration the extent of generalizability of the findings that we will reach at the end, and because of the ease to divide the staff upon meaningful issues to classes, so I chose the Stratified Random Sample, as the most efficient method in the probability sampling methods.
First I divided the administrative employees into three levels according to their work positions as they were appeared in our records, then I found the percentage for each level from the total number (1000), 500 are low level(junior and service employees), 350 are middle(seniors and head of sections) and the rest (150) are high level(manger, directors and above), in order to reflect this percent as it is possible, in our sample size, so the sample size was distributed as following:
- The low level (15 employees).
- The middle level (10 employees).
- The high level (5 employees).
Then a random selection had been used in every level.
Chapter Four
4.1 Data Collection Method:
4.1.1 The Questionnaire:
The main toll for collecting data was the questionnaire, in addition to the preliminary data collection and the informal interviews at the beginning of the study, which were useful and helped me in developing the questionnaire itself.
The questionnaire included questions that are related to the variables in the study, and some other questions were added to give us possibility to some descriptive analysis in the end. So the questionnaire contained question upon the independent variables (age, position, decision involvement and rewards). And the dependent variable (Motivation) which is an operational variable that has been indicated through its elements).
4.1.2 The Scaling:
The questionnaire included 6 items, with 15 questions, and the variables were scaled as follows:
- Age was measured using the open ended (Ratio Scale).
-Position and sex were measured using the nominal scale, to provide us with some classification and categories to the data if we need it in the final analysis.
- Decision involvement and Rewards were measured using 7-points numerical scale.
-Likart Scale had been used to indicate and measure the operational variable (Motivation), which had been divided into 10 elements, with 5 answers for each, that reflect its concept and consist its dimensions, and the respondents were asked to answer them by chose one of the five answers which is ranked form "strongly agree" to "strongly disagree".
4.2 The goodness of measure:
4.2.1 Validity
The questionnaire used in the study was given to specialized researchers as to check the content validity of the operational variable and that it measures the variables that need to be measured really. A little change was made in the questionnaire based on the researchers note as to raise its validity. The final comments of these experts –after modifying the questionnaire according to their recommendations– were that the instrument used in this study is of high validity.
4.2.2 Reliability
The reliability of the questionnaire was checked by measuring the internal consistency of the operational variable (i.e. Motivation) that is the homogeneity of the questions asked. The measure is the Cronbach Alpha coefficient. The coefficient was found to equal 0.78 which is a high and good value. We can confidently consider the instrument used in this study as reliable.
Reliability Statistics
4.2.3 Data Checking and Data Entry:
After we prepared the questionnaire, and after distributing and collect them, I had checked them, to insure that all items had been answered fully or some missing occurred, I had found that all questions were answered completely, and the response percent were 100% for the 30 employees.
When the questionnaires had been collected and checked, then I decided to use the SPSS software program in order to analyze the collected data and the meaning of the calculations that we will reach after entering it on this program. The data Entry were a reflection to the exact questionnaire, after defining the variables, and then all questionnaires had been entered.
4.3 Data Analysis and the results:
In order to analyze the data, and to get the final analysis, the Regression analysis Technique was used and applied to test the hypotheses, and to give us the significance and the coefficients that is important to express the relations between the variables and its importance and affecting.
The following is the main output of the Regression analysis; it will be followed by our analysis and explanations:
Regression Results and Meanings:
Variables Entered/Removed (b)
a All requested variables entered.
b Dependent Variable: Motivation
Model Summary
a Predictors: (Constant), rewards, Employee age, decision, position
From the above Regression results, especially from the (R Square= 0.854),this is the Correlation coefficient(it always lies between 0 and 1), which means that the Four independent variables together (rewards, Age, position and decision involvement) affect strongly the Dependent Variable(Motivation) and 0.854 of the variations in the Motivation is explained by these Four variables, which refers to a strong high correlation between the independent variables and the dependent, while the rest of the variations(0.115) cannot be explained by the four independent variables that is included in our study, and this means that there are other factors affect Motivation and explain only (0.115) of its variations.
Because of this high result of R square we can consider that the four independent variables are the main variables that affect Motivation and responsible for it's almost variations. This led us to reject the Null Hypothesis and accept the Alternate Hypothesis.
From Anova results, we see that the calculated Significant is equal to 000.0, and this is less than the 0.05 (which means 95% level of confidence as a standard of our study), this means and assure us to that there is effect and correlation between the independent variables and the dependent, which give us more information to reject the Null Hypothesis and to accept the Alternate Hypothesis.
Coefficients Meanings:
From the Beta Coefficients we can express the nature of the relation (positive or negative relation from the sign of the coefficients) between each variable of the independents and the dependent variable, also we can classify the independent variables according to their importance in explaining the variation in the dependent variable, Motivation, (we look to the absolute value of Beta Coefficients, then the larger one is the more important its factor that affect the dependent variable). From this table also we can form the Regression equation, to predict the dependent variable (here we look to the significance of the factors, and every significant is less than 0.05 we consider it in the equation and whose significant is greater than 0.05 we ignore it).
Nature of the relations:
-
The Age Beta Coefficient is positive, which means it has a positive relation with the motivation, and this agrees with our knowledge and the previous studies in the literature review.
-
The position Beta Coefficient is positive, which means it has a positive relation with the motivation, and this agrees with our knowledge and the previous studies in the literature review.
-
The decision involvement Beta Coefficient is positive, which means it has a positive relation with the motivation, and this agrees with our knowledge and the previous studies in the literature review.
-
The rewards Beta Coefficient is positive, which means it has a positive relation with the motivation, and this agrees with our knowledge and the previous studies in the literature review.
The Importance of Ranking of the independent variables:
When we look to the Beta Coefficients absolute value, we find that the importance order is firstly to the decision involvement (2.218), secondly to the rewards (2.207), thirdly to the position (0.975) and finally to the age variable (0.107).
The Regression Equation:
The regression equation is used to predict and estimate the dependent variable (motivation) values, and its value will vary according to the significant independent variables in it and its coefficients and their signs, (the general form for the equation is Y(Y hat) = Constant + B1X1 + B2 X2 + B3X3 + …BnXn) where Y is the estimated dependent variable, B1 and B2…are the Coefficients, X1 and X2…are the independent variables in the study.
In order to form the equation, we see the significant for each independent variable, and which is less than 0.05 we put it in the equation and the greater will be ignored, so our Regression Equation is:
Y (hat) = 10.374 + 2.218 X1 + 2.207X2
Where Y is the estimated Dependent Variable (motivation), X1 is the decision involvement and X2 is the rewards.
4.4 Conclusions and Recommendations:
-
The study achieved its goals and answered its problem statement, and the independent variables (Rewards, Decision involvement, Age, and position) explained 85.4% of the variance of the dependent variable (Motivation), and so no needs to do another study, and it is vital to deal with the results that had been shown.
- The data analysis showed us that the Decision involvement is the most important factor affects the Motivation, so the human resource management should increase the degree of the decision involvement in order to raise the motivation level for the employees.
- As the Rewards are the second factor of influencing the motivation, the human resource management should enhance the rewards system in order to have more motivated employees.
- The position and age do not have a big influence on the motivation level so there should not be a big focus on these variables.
- Finally the human resource management can use the regression equation to estimate the motivation levels for the employees if they can measure the decision involvement and the rewards for the employees.
REFERENCES
Adams, J.S. (1965). Inequity in social exchange in Berkowitz. Advances in Experimental Social Psychology, 21, 267-99. New York
Adair, J. (1990). Understanding Motivation. London: Talbot Adair Press.
Graham, M. W. & Messner, P. E. (1998). Principals and job satisfaction. International Journal of Educational Management, 12, 196–202.
Herzberg, F., Mausner, B. & Snyderman, B. (1959). The motivation to work. New York: John Wiley & sons.
Jenkins, G.D., Jr., & Lawler, E.E. III. (1981). Impact of employee participation in pay plan development. Organizational Behavior and Human Performance, 28, 111-128.
Mathis, R. L. & Jackson, J. H. (1994). Human Resource Management. USA : West Publishing Corporation.
Reeve, J. (1996). Motivating others: Nurturing inner motivational resources. Massachusetts: Allyn & Bacon.
Reis, D. & Leticia, P. (2001). Reengineering the motivation to work.. Management Decision, 39, 666-675.
Robbins, S. P. (1996). Organizational Behavior. USA: Prentice Hall International.
Vroom, V. H. (1964). Work and Motivation. New York: John Wiley & Sons.
Appendix One
Dear Sir,
We hope you will cooperate with us by answering these questions. It will not take you very long; there is no need to write down your name. Please be confident that your answers will be kept for scientific research purposes only.
Finally I would like to thank you in advance for filling this questionnaire.
The Questionnaire
Questionnaire #: ____
-
Age: ________________ years.
- Gender
1: Male.
2: Female.
- Position at the company:
1: Junior employee or service employee.
2: Senior employee or Head of section.
3: Manger or Director or above.
- Please state the extent to which you agree with each of the following statements (Put × sign):