PRELIMINARY METHODOLGY
1.0ml of buffer solution, 2.0ml of water and 0.5ml of substrate were placed, using a Gilson pipette, into a standard, clear, dry test tube. The Gilson pipette was used with care and precision, in accordance to the manual instructions, in order to obtain accurate measurements. This was incubated in a 300 C water bath for 5 minutes, which was timed using a stop clock. The spectrophotometer was set to 405nm and zeroed with distilled water. The test tube was then removed from the water bath and the contents transferred to a curvette, using a pipette to maintain accuracy. The 0.5ml of enzyme solution was added and the curvette was immediately sealed using parafilm. The curvette was then mixed gently by lightly tilting it upwards and downwards. This was then placed quickly into the spectrophotometer and the absorbance was read immediately as the timer started. The absorbance was then subsequently read every 30 seconds for 6 minutes.
PRELIMINARY RESULTS
GRAPH (SEE FIG.1), A SCATTERGRAPH TO SHOW THE RATE OF REACTION BETWEEN ALKALINE PHOSPHATASE AND P-NITROPHENYL PHOSPHATE
CALCULATION OF INITIAL RATE OF REACTION
The initial rate of reaction was calculated by drawing a line of best fit on the graph, of which the majority was of the line used for the calculation, using the equation,
Therefore, m= 0.862-0.482
3-0
m= 0.127au/m
PRELIMINARY DISCUSSION
The preliminary experiment produced and initial rate of reaction of 0.127au/m. Therefore the enzyme concentration used was of an appropriate level because it produced a rate of reaction around that of 0.1. As such when the concentration of
the substrate is varied, the initial rates of reaction that are produced will all be of a relatively comparable nature and therefore this will allow for the accurate creation of a Lineweaver-Burk plot. The preliminary investigation ran smoothly and there was no need for dramatic alterations to the method however it must be noted that there were slight inaccuracies involving the measurement of the wavelength at 0 seconds. The value obtained from the preliminary experiment appears to be too large considering the reaction has occurred for such a minimal time and therefore in the main experiment the curvette will be more quickly placed into the spectrophotometer.
MAIN EXPERIMENT
ALTERATIONS AND CHANGES
The experiment methodology remained as before, however more precision was sought when measuring the 0 second reading from the spectrophotometer, as this would heavily influence the values obtained for the initial rate of reaction. The concentration of the enzyme remained at 0.5ml as this would provide results from which a Lineweaver-Burk plot could be drawn clearly.
The apparatus remained the same as within the preliminary experiment.
METHOD
The only change to the method was that the concentration of the substrate altered within each experiment. Substrate concentrations were altered by varying the amount of substrate added and in accordance altering the amount of water added, in order to achieve a total volume in the curvette of 4.0ml. It was decided that five separate enzyme concentrations would be used as this would generate enough initial rates of reaction to be able to plot a Lineweaver-Burk plot accurately. The volumes of substrate used were 0.1ml, 0.133ml, 0.2ml, 0.4ml, and 2ml. These would produce substrate concentrations which, when plotted as a reciprocal on the Lineweaver-Burk plot, produce a representative line of best which would not be susceptible to anomalies results. When in reciprocal form the substrate concentrations would be roughly equally separated on the x-axis, aiding in the drawing of a line of best fit which would be required in order to obtain the values of Km and Vmax..
The various different substrate concentrations were obtained by using the following volumes of buffer, substrate, enzyme and water in each curvette.
FIG 2: A Table to show the volumes of substances added
Substrate concentration, expressed in mM, were calculated as follows:
Concentration of stock substrate x volume of substrate x 1000
total volume
e.g Experiment No. 1 = 0.02 x 0.1 x 1000
4
= 0.5mM
The method remained as was described within the preliminary experiment. Each experiment lasted for 6 minutes with reading All test tubes were placed in the same waterbath at the same time and removed only when required. Test tubes were labeled with a marker pen to avoid errors and cross-contamination. Between each experiment the curvette was washed and dried and the spectrophotometer zeroed in order to remove inaccuracies in results. The tips of the Gilson pipette were also replaced between each investigation to remove and possibility of cross contamination.
RESULTS
FIG 3: TABLE OF RAW RESULTS
GRAPH (SEE FIG.4), SCATTERGRAPHS TO SHOW THE RATES OF REACTION BETWEEN ALKAINE PHOSPHATASE AND P-NITROPHENYL PHOSPHATE OF VARYING CONCENTRATIONS
The rates of reaction were calculated as before in the preliminary experiment.
FIG 5: TABLE OF INITIAL RATES OF REACTION
LINEWEAVER-BURK PLOT (SEE FIG. 6), A LINEWEAVER-BURK DOUBLE RECIPROCAL PLOT TO DETERMINE Km and Vmax VALUES OF ALKALINE PHOSPHATASE
CALCULATION OF KM AND VMAX VALUES
They y-intercept of the line of best fit on the Lineweaver-Burk plot is equal to the value of 1/Vmax. This value was read off the graph as 3.8 au/M -1. Therefore, using simple algebra, Vmax was calculated to be 0.263 au/M -1 (3sf).
Vmax = 0.263 au/M -1 (3sf)
The x-intercept of the line of best fit on the Lineweaver-Burk plot is equal to the value of -1/Km. This value was read off the graph as -0.54mM-1. Therefore, using simple algebra, Km was calculated to be 1.85 mM-1. (3sf).
KM = 1.85 mM-1 (3sf)
DISCUSSION
FIG 4, the scattergraphs used to determine the initial rates of reaction, showed that as the concentration of the substrate increased, the steepness of the line of best fit also increased. Therefore as the gradient of the line increased as the substrate concentration increased it is an indication that the initial rate of the reaction increased as the substrate concentration increased. From observing the lines of best fit it is also apparent that there is no anomalous results because all points fell close to the line of best fit. This suggests that the results that were obtained are likely to have a high level of accuracy and therefore reliable conclusions can be drawn from them. The Lineweaver-Burk plot, as shown in FIG 6, that was then drawn, using 1/[s] and 1/V, also produced a straight line of best fit. No anomalous results were noted because again each point lay close to the line of best fit. It also seemed apparent that the five different substrate concentrations that were used represented enough readings in order to obtain an accurate line of best fit. This is because any anomalous results would have been clearly identifiable. Moreover the substrate concentrations which were used were also appropriate because they generated evenly spread out points, when in the reciprocal form on the Lineweaver-Burk plot, aiding in the drawing of the line of best fit. This in turn ensured that accurate values of -1/Km and 1/Vmax could be read off the x and y-axes respectively. Values of Km and Vmax were then subsequently obtained through simple algebra.
CONCLUSION
FIG 4, the scattergraphs showing the initial rate of reaction between alkaline phosphatase and p-nitrophenyl phosphate of varying concentration indicates that as the concentration of substrate increases, the initial rate of the reaction increases. This is evidenced by the fact that as the concentration of substrate increased the gradient of the line of best fit increased. FIG 5 indicates the increase in concentration, which rose from 0.053 au/m at 0.5mM to 0.204au/m at 10mM. The increase in rate of reaction is due to the fact that as the amount of substrate molecules increase, more enzyme-substrate complexes form which increases the rate of reaction. At low substrate concentrations, the catalytic site of the enzyme is empty and is waiting for the substrate to bind. The rate of the reaction is therefore limited by the concentration of the substrate that is available. As the concentration of the substrate increase, the enzyme now becomes saturated with substrate and more enzyme-substrate complexes form due to the increase in the number of substrate molecules. This therefore increases the initial rate of the reaction.
A Lineweaver-Burk double reciprocal plot was used instead of simply plotting substrate concentration against rate of reaction because if this had been done accurate values for Km and Vmax could not have been obtained as only an asymptote would be produced instead a line of best fit which crosses the y and x-axes indicated 1/ Vmax and -1/ Km respectively. Using the Lineweaver-Burk plot (FIG 6), it was possible to obtain values for Km and Vmax. Km and Vmax were recorded as 1.85 mM-1. (3sf) and 0.263 au/M -1 (3sf) respectively. Vmax is equal to the rate of the reaction when the enzyme is saturated with substrate and therefore 1.85 mM-1 is the maximum rate of reaction for the enzyme alkaline phosphatase. The relationship between rate of reaction and concentration of substrate depends on the affinity of the enzyme for its substrate. This is usually expressed as the Km, the Michaelis constant, of the enzyme, which is an inverse measure of affinity. Km is the concentration of substrate that allows the enzyme to achieve half Vmax. An enzyme with a high Km has a low affinity for its substrate, and requires a greater concentration of substrate to achieve Vmax.
With the knowledge of these kinetic parameters, isoenzymes of alkaline phosphatase can be distinguished between This is because different isoenzymes are present in different tissues of the body and alter in amino acid sequence, although catalyse the same reaction, and therefore they alter in kinetic characteristics. As such, Km and Vmax values can be used, in conjunction with other clinically tests, to ascertain where damage has occurred within the body3. This is because when tissue damage occurs, cells release their contents into the plasma.
EVALUATION
From observing the line of best fit on the Lineweaver-Burk plot it appears that there was a high level of accuracy within the investigation and that therefore the conclusions and values that have been obtained are likely to be reliable. This is because all points fell extremely close to the line of best fit, indicating there were no anomalous results or outliers. The range of substrate concentrations that were used was also appropriate because when substrate concentration was in reciprocal form, as on the x-axis of the Lineweaver-Burk plot, it provided points that were evenly spaced out and this therefore aided in the drawing of an accurate line of best fit. It also created a point at 0.1 mM-1 , which therefore ensured that the line of best fit crossed the y-axis at the most accurate point, therefore ensuring that the value obtained for Vmax was as reliable as possible.
It must however be noted that some errors may have entered the investigation, although these are likely to be minimal and not have a major impact on the values of Km and Vmax obtained. The main area where inaccuracies may have been present is the recording of the initial wavelengths from the spectrophotometer at 0 seconds. This is because some time elapsed between all the contents being added to the curvette, the curvette being shaken gently and then placed into the spectrophotometer. Although the Gilson pipette are extremely accurate, each has a slight degree of variation and this combined with slight human error may have lead to minor discrepancies involving measurement. It must also be noted that although the water was constant there was a ± 10 C which may have affected enzyme activity slightly.
In order to improve the accuracy and reliability of the conclusions and values obtained, primarily repeats should be carried out. Each substrate concentration should be used three times, as this will clearly identify any anomalous results. Moreover a wider range of substrate concentrations could be used. The range could be increased and extended to around 5mM as this would provide an indication as to whether the rate of the reaction leveled off. This would suggest that the activity of the enzyme would become the limiting step, as opposed to the availability of substrate molecules.
The spectrophotometric continuous enzyme assay used in this experiment provides a clear quantitative insight into the kinetic parameters of alkaline phosphatase. Using the values of Km and Vmax obtained, various isoenzymes of alkaline phosphatase can be distinguished between. As such it can be used as a diagnostic tool because it can identify between different forms of the enzyme that come from different parts of the body, from different tissue. Therefore it can be used to identify between alkaline phosphates from osteoblasts and the biliary tract. Therefore it can distinguish between different conditions and diseases, which alter the levels of alkaline phosphatase, because it can be used to identify between isoenzymes of alkaline phosphatase.
REFERENCES
1. A G Gornall. (1980). Applied Biochemistry of Clinical Disorders, 2nd edn. Lippincott ,Williams and Williams.
2. K Lewandroski. (2002). Clinical Chemistry: Laboratory Management and Clinical Correlations, 1st edn. Lippincott, Williams and Williams.
3. A L Latner. (1975). Clinical Biochemistry, 1st edn. Cantarow and Trumper.
1. CLINICAL DIAGNOSIS USING ALKALINE PHOSPHATASE
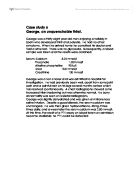
PATIENT 1
Patient 1 has an elevated level of Bilirubin, ALT and Alkaline phosphatase. This indicates that within the body, the liver function is abnormal. Due to the fact that Alkaline phosphatase levels are much higher than ALT, this rules out cirrhosis of the liver. Also a pancreatic tumour can be ruled out because the patient has indicated that they have had recurrent abdominal pain for a period of a year, however no substantial weight loss has been noted. Significant weight loss is a typical symptom of a pancreatic tumour.
Gallstones within the gall bladder or bile duct are suspected because whilst at first they remain asymptomatic, they then can cause abdominal pain, of which it is documented that the patient is suffering from. Moreover the patient has described nausea after digesting a fatty meal, a typical symptom of gallstone. In addition jaundice does not necessarily present until it reaches a severe state, which ties into the patient’s case. Also the patient, a 40-year-old female, is a typical sufferer of gallstones. Although cholestasis is a possibility, it is unlikely because the patient has not been suffering from itchiness or noticed pale stools and dark urine, typical signs of cholestasis. A CT scan of the gall bladder and bile duct would confirm gallstones.
PATIENT 2
Patient 2 has elevated levels of Bilirubin, ALT and Alkaline phosphatase. This indicates that within the body, liver function is abnormal. Due to the fact that ALT levels are higher than alkaline phosphatase levels, cirrhosis of the liver is predicted. This clearly ties into the patient’s history, which details an extremely high daily alcohol intake. Moreover the patient has not suffered from abdominal pain but has noticed the development of jaundice, which is a clear indicator of liver cirrhosis. This diagnosis should be confirmed through a liver biopsy. A CT scan would also be useful to rule out the possibility of pancreatic cancer, which could possibly be symptomless.
PATIENT 3
Patient 3 has an elevated level of alkaline phosphatase however levels of bilirubin and ALT fall within normal parameters. This indicates that the patient is suffering from a disease of the bone, where there is increased osteoblastic activity. Osteomalacia can be ruled out because the patient is asymptomatic and there is no sign of diffuse body pains, muscle weakness or fragile bones. Therefore both Paget’s disease and hyperparathryodism are suspected because both are associated bone diseases that are typically symptomless. In order to determine whether it is Paget’s disease, bone scans can be performed as well as X-rays because pagetic bone has an identifiable characteristic appearance. In order to determine whether it is hyperparathyroidism, blood tests can be performed. These will indicate elevated calcium levels and more significantly the levels of parathyroid hormone, which would be responsible for increased calcium levels.
2. INHIBITION STUDIES ON ALKALINE PHOSPHATASE
The initial rate of reaction was calculated by drawing a line of best fit on the graph, of which the majority of the line was used for the calculation, using the equation,
Therefore, m= 0.045-0.035
2.5-0.5
m= 0.05au/m
The remaining rates of reaction were all calculated as above.
TABLE TO SHOW VALUES OF 1/S AND 1/V WITHOUT AN INHIBITOR
TABLE TO SHOW VALUES OF 1/S AND 1/V WITH AN INHIBITOR
CALCULATION OF KM AND VMAX VALUES
They y-intercept of the line of best fit on the Lineweaver-Burk plot is equal to the value of 1/Vmax. Both the Lineweaver-Burk plots, for with and without the inhibitor, crossed the y-axis at the same point. This indicates that they have the same Vmax values. This value was read off the graph as 7.8 au/M -1. Therefore, using simple algebra, Vmax was calculated to be 0.128 au/M -1 (3sf).
Vmax without inhibitor = 0.128 au/M -1 (3sf)
Vmax with inhibitor = 0.128 au/M -1 (3sf)
The x-intercept of the line of best fit on the Lineweaver-Burk plot is equal to the value of -1/Km. Unlike Vmax, the value of Km differed between if the inhibitor was present or not. Without the inhibitor, this value was read off the graph as
-0.4mM-1. Therefore, using simple algebra, Km was calculated to be 2.50 mM-1. (3sf). With the inhibitor, the value was read of as -0.08mM-1 . This is a Km value of 12.5 mM-1
KM without inhibitor = 2.50 mM-1 (3sf)
KM with inhibitor = 12.5 mM-1 (3sf)
Due to the fact that the Vmax values are equal but the Km values differ, the type of inhibitor used is identified as a competitive inhibitor. A competitive inhibitor is likely to have a similar structural form to that of the normal substrate and therefore it competes with the substrate for the active sites of the enzyme. The competitive inhibitor will bind reversibly to the enzyme and will not bind at the same time as the substrate molecule. This therefore means that at high substrate concentrations, the competitive inhibitor can be overcome by the more available and numerous substrate molecules. As such, the Vmax does not alter but instead the affinity of the enzyme for the substrate decreases, with an inhibitor present, and thus the value of Km increases.