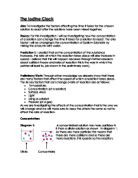
Rates of Reaction - The Iodine Clock
A-Level Investigation
Rates of Reaction - The Iodine Clock
Aim: carry out investigations to determine the rate equation for the oxidation of iodide ions by hydrogen peroxide in acid solution. Investigate the effect of various transition metal catalysts on the reaction rate.
Introduction to research
The research of this project involved investigation of a range of scientific literature available from Oxford University's online science library, various chemistry texts and other Internet sources.
The Iodine clock reaction
This reaction has been used repeatedly down the years in the study of reaction rates. Most famously by Harcourt and Esson in the late 18th - early 19th century. The reaction between hydrogen peroxide and iodide ions is still known as the Harcourt-Esson reaction.
The Iodine Clock reaction can be represented by the half equations:
H2O2 (aq) + I- (aq) --> IO- (aq) + H2O (l) Slow [1]
IO- (aq) + H3O+ (aq) - HIO (aq) + H2O (l) Fast [2]
HIO (aq) + H3O+ (aq) + I- (aq) --> I2 (aq) + 2H2O (l) Fast [3]
Overall:
2H+ + H2O2 + 2I- --> 2H2O + I2
Iodide ions are oxidised to diatomic iodine molecules. These are soluble in water and will turn it a pale brown color. In this experiment the presence of starch will emphasize the color change at the end-point of the reaction by forming a deep blue complex with the iodine.
Use of Sodium Thiosulphate [ Na2S2O3 ]
Sodium Thiosulphate(VI) is a reducing agent. In the iodine clock reaction, it plays the following part:
Half equations;
2S2O32- (aq) --> S4O62- (aq) + 2e-
I2 (aq) + 2e- --> 2I- (aq)
Overall:
2S2O32- (aq) + I2 (aq) --> S4O62- (aq) + 2I- (aq)
The Thiosulphate has the effect of reducing iodine to iodide ions. Since the Iodine Clock Reaction is basically the conversion of iodide ions to iodine, the Thiosulphate actually does the reverse. The function of the Thiosulphate is to slow the reaction down, as without the Na2S2O3 the reaction would prove to be too fast to provide suitable results.
Introduction to Reaction Rates
Increasing the concentration of a reactant normally increases the rate of reaction, but this is not always the case. The different reactants can affect the particular reaction in different ways e.g.: doubling concentration can double or even quadruple a reaction rate, but it could also have no effect whatsoever.
In a reaction with more than one step the rate will be dictated by the rate of the slowest stage in the reaction mechanism - this is called the rate-determining or rate-limiting step.
In a reaction; if the doubling of the concentration of a reactant has the effect of doubling the reaction rate - it is said to be first order with respect to the concentration of that chemical. If a doubling of concentration causes the rate to quadruple - then it is referred to as second order. Similarly, if the increase in concentration has no effect, then it is known as zeroth order with respect to that reactant.
The order with respect to a particular reagent is known as a singular order, however, the overall order of a reaction is found by adding together all the singular order involved.
E.g.
In the reaction A + B --> C
Doubling the concentration of reactant A doubles the rate ?First order w.r.t. [A]
Doubling the concentration of reactant B quadruples the rate ?second order w.r.t. [B]
The rate equation for this reaction can therefore be written as:
Rate of Reaction ? [A]1[B]2 = k [A] [B] 2
The overall order would be equal to three.
To determine the order of a reaction by graphical means:
By performing an experiment repeatedly, varying the concentrations of a particular variable whilst keeping the other volumes and conditions constant, it is possible to determine the order of reaction with respect to that chemical. When enough values of reaction time are obtained a graph may be plotted: ?-axis concentration of reactant, y-axis 1/reaction time (rate of reaction). From the shape of this graph it is possible to determine the order of the reaction with respect to that reactant. For example:
Figure 1.1
Zeroth Order
First Order
Second Order
Prediction of Rate Equation
For the Iodine Clock Reaction I predict that the reaction will be;
Zero order with respect to [H+]
First order with respect to [H2O2]
First order with respect to [I-]
Therefore I predict that the overall rate equation will be:
Rate = k [ H+ ]0 [ H2O2 ]1 [ I- ]1
Which gives an overall reaction order of two.
Variables
In this investigation it is necessary to investigate the effect of varying the concentration of three chemicals in the Iodine Clock Reaction. I am therefore required to perform three different experiments, changing the concentration of a single variable in each one. This will mean that the variables, independent and controlled, will change in each 'set'. All experiments should be performed at standard temperature and pressure (S.T.P.) - 298K and 1 ATM pressure.
For example;
When varying the volume of Hydrogen Peroxide in the mixture it will be the independent variable, the controlled variables will be the volumes of the Thiosulphate, Potassium Iodide and Sulphuric Acid. The overall volume will be kept constant by the addition of a measured volume of distilled water that will make the solution up to 200ml (including 1ml of 1% starch solution). The dependant variable will obviously be the time taken for the reaction to reach end point (signified by the solution color change clear to deep blue).
Expt. (1)
Independent variable:
Volume Potassium Iodide
Controlled variables:
Volume Thiosulphate
Volume Hydrogen Peroxide
Volume Sulphuric Acid
Temperature
Total solution volume
Volume starch
Pressure
Dependent variable:
Time
Expt. (2)
Independent variable:
Volume Hydrogen Peroxide
Controlled variables:
Volume Thiosulphate
Volume Potassium Iodide
Volume Sulphuric Acid
Temperature
Total solution volume
Volume starch
Pressure
Dependent variable:
Time
Expt. (3)
Independent variable:
Volume Sulphuric Acid
Controlled variables:
Volume ...
This is a preview of the whole essay
Expt. (1)
Independent variable:
Volume Potassium Iodide
Controlled variables:
Volume Thiosulphate
Volume Hydrogen Peroxide
Volume Sulphuric Acid
Temperature
Total solution volume
Volume starch
Pressure
Dependent variable:
Time
Expt. (2)
Independent variable:
Volume Hydrogen Peroxide
Controlled variables:
Volume Thiosulphate
Volume Potassium Iodide
Volume Sulphuric Acid
Temperature
Total solution volume
Volume starch
Pressure
Dependent variable:
Time
Expt. (3)
Independent variable:
Volume Sulphuric Acid
Controlled variables:
Volume Thiosulphate
Volume Potassium Iodide
Volume Hydrogen Peroxide
Temperature
Total solution volume
Volume starch
Pressure
Dependent variable:
Time
Possible Methods of Measuring Reaction Time
Spectrophotometer
The spectrophotometer provides an alternative means of measuring the end point of this reaction. The device works by measuring changes in the absorption spectrum of the solution. Since the reaction end point is characterised by a striking change from clear to deep blue (or clear to pale brown if no starch is present), the device will provide very accurate, but more importantly - very consistent timing of the reaction.
This method however is not practical in our situation because there are not enough spectrophotometers in the lab for everyone. Instead I will simply be timing the reaction by judging with my eye when the end point has been reached. For this reason I will add starch to the reaction vessel, this will show up a deep blue color when the end point has been reached (the iodine forms a blue complex with the starch).
Safety Considerations
Safety glasses and disposable gloves must be worn at all times as we are dealing with concentrated acids and Sodium Thiosulphate which is a strong oxidant. It is also possible for iodine to stain skin.
Apparatus
Beakers (100ml)
Biurets (50ml)
Conical Flasks (250ml)
Measuring Cylinders (10ml, 200ml)
Stopwatch
Syringe (5ml)
Wash bottles
White tile
Method and Modification Notes
Chemicals Required;
All the standard solutions should be made readily available in the lab. Potassium Iodide (0.1M and 1M), Sodium Thiosulphate (0.25M and 0.025M), Hydrogen Peroxide (2 and 20 volume) and Sulphuric Acid (0.1M and 1M) are all stored in biurets at the side of the lab. It is possible for the Potassium Iodide to 'go off' (iodide ions will oxidise to iodine in the presence of oxygen), it is therefore necessary to use freshly made KI solution. Fresh distilled water should also be available in wash bottles and as a large quantity in a tank. The starch solution should be kept in a fridge as it can provide an excellent medium for bacterial growth.
Trial experiments should be performed for each of the three variables to determine the volumes of non-limiting reagents (controlled variables) that will exhibit the best possible range of results when reacted together along with the limiting reagent. The best range (and therefore chemical mixture) is one that shows quite a large variation in time for a small change in the concentration of limiting reagent (independent variable), the times for the reaction to reach the end-point should lie between approximately thirty seconds (for the fastest) and three minutes (for the longest). The results for the trials that I performed are contained within the results section. Once the volumes of the controlled variables are determined for each set of experiments they should not be altered. After investigation, I decided to use these constant volumes for each of the controlled variables.
When varying volume KI: (KI volumes 2, 4, 6, 8, 10, 12ml - 0.1M)
Table 1.1
Reagent
Concentration
Volume (ml)
Na2S2O3
0.025M
2
H2O2
20 Volume
0
H2SO4
M
0
When varying volume H2O2: (H2O2 volumes 5, 10, 12, 14, 16, 18, 20ml - 2 volume)
Table 1.2
Reagent
Concentration
Volume (ml)
Na2S2O3
0.025M
0
KI
M
8
H2SO4
M
5
When varying volume H2SO4: (H2SO4 volumes 10, 12, 14, 16, 18, 20ml - 0.1M)
Table 1.3
Reagent
Concentration
Volume (ml)
Na2S2O3
0.25M
8
H2O2
20 Volume
0
KI
M
0
Each solution that is made up will contain 1ml of 1% starch solution, the appropriate volume of the limiting reagent and a volume of distilled water that will make the solution up to a uniform volume of 200ml (0.2dm).
The following was discovered during the experiment as a number of reactions failed to run to completion. It should be regarded as a modification to experimental method:
When mixing chemicals prior to starting the reaction, the Hydrogen peroxide should be kept separate from the acid and the Potassium Iodide. However, instead of keeping all the reactants separate and introducing more timing error in the final mixing, it was possible to store the Peroxide, water and the starch in one vessel and the Potassium Iodide, Thiosulphate and Sulphuric Acid in another. Pouring into a large conical flask can then quickly mix the contents of the two containers. The stopwatch should be started simultaneously.
Pre-Experimental Preparation
All the required chemicals [Potassium Iodide (0.1M and 1M), Sodium Thiosulphate (0.25M and 0.025M), Hydrogen Peroxide (2 and 20 volume) and Sulphuric Acid (0.1M and 1M)] should be readily available in 50ml volumes in biurets in the lab. Wash out all apparatus used to hold reactants with distilled water so as to prevent contamination. This should also be done between repeats. Prepare fresh 1% starch solution. When performing a set of experiments (i.e. the entire investigation of one variable) the experiment, including repeats, should be performed in the one session - this will minimize errors introduced by daily fluctuations in temperature.
Walkthrough of first experimental set: Investigating Potassium Iodide as the independent variable
(1). In a washed 250ml conical flask collect the first volume of the independent variable, in this case 2ml of 0.1 Molar KI, from the filled biuret.
(2). Add to this 2ml of 0.025 Molar Sodium Thiosulphate and 10ml of 1 Molar Sulphuric Acid - All volumes are measured from the prepared biurets.
(3). In a separate 250ml conical flask, collect 10ml of 20 volume Hydrogen Peroxide.
(4). Measure out 1ml of 1% starch solution using a 5ml syringe. Add this to the second flask
(5). Measure out the required volume of distilled water needed to make the total volume up to 200ml, in this case 177ml. Using a 200ml measuring cylinder - fill to the approximate level from the water tank then use a dropper to correct to the exact amount. Add this to the second flask also.
(6). The first experiment is now prepared. Holding the flask over a white tile, transfer the contents of both flasks into a single conical flask - start the stopwatch simultaneously.
(7). Swirl the contents of the flask at a uniform rate above the white tile until the reaction reaches end-point. This is signified by a change in the solution color from clear to deep blue.
(8). Immediately as the reaction reaches this point, stop the stopwatch. Record the time to the nearest second.
(9). Repeat this reaction using the same volumes of reactants to obtain a second result. If there were massive variations (>20seconds) it would be advisable to repeat again to eliminate a possible rogue result.
(10). Repeat steps 1 to 9 for the remaining volumes of independent variable (in this case 0.1 Molar KI - 4ml, 6ml, 8ml, 10ml and 12ml) adjusting the distilled water content of the solution to keep the overall solution volume at a constant 200ml (respectively 175ml, 173ml, 171ml, 169ml and 167ml).
(11). In the same fashion, perform sets of experiments to investigate the effects of varying the concentration of the other reactants: Potassium Iodide and Sulphuric Acid. The various concentrations and volumes for these investigations are listed in Tables 1.2 and 1.3 above.
(12). Once all values have been obtained it is necessary to plot graphs of rate against concentration (or volume) limiting reagent (independent variable). To calculate reaction rate:
Reaction Rate = 1/REACTION TIME
To calculate reactant concentration in the solution: using n = cv
Concentration reagent (in solution) = Moles reagent
Total solution volume (constant 0.2dm)
Where: Moles reagent = Concentration x Volume
Units: Concentration: moldm-3
Volume: dm
Rate: seconds-1
(13). The graph Rate against Concentration (or volume) should be plotted with ?-axis representing Concentration and y-axis representing Reaction Rate x103 (by raising the reaction rate it will make the numbers easier to work with).
(14). To determine the order of the reaction with respect to the concentration of a particular the shape of the graph it produces should be compared with the example below:
Figure 2.1
Green line represents 2nd order
Red line represents 1st order
Blue line represents 0th order
The overall order can then be deduced by addition of the singular orders w.r.t. H2O2, KI and H2SO4.
The rate equation can then be written in the form:
Rate = k [ H+ ] ? [ H2O2 ]y [ I- ]z
? = Order w.r.t. [ H2SO4 ]
y = Order w.r.t. [H2O2 ]
z = Order w.r.t. [ KI ]
Apart from modifications previously noted, I found no other reason to modify my experimental method during the course of the investigation.
RESULTS 1
Concentrations for set: Varying concentration KI
Na2S2O3
0.025M
KI
0.1M
H2O2
20 Volume
H2SO4
M
TRIALS:
Volume (ml)
H2O
67
64
73
63
Na2S2O3
2
5
5
5
KI
0
0
2
0
H2O2
0
0
5
5
H2SO4
0
0
0
0
Starch
Time (secs)
7.5
24
213
44
RESULTS:
2
3
4
5
6
Volume (ml)
H2O
77
75
73
71
69
67
Na2S2O3
5
5
5
5
5
5
KI
2
4
6
8
0
2
H2O2
5
5
5
5
5
5
H2SO4
0
0
0
0
0
0
Starch
Time (seconds)
Result 1
63
99
60
49
38
31
Result 2
60
94
54
48
32
20
Average Time
61.5
96.5
57
48.5
35
25.5
/TAVG
0.006192
0.010363
0.017544
0.020619
0.028571
0.039216
/TAVG x103
6.192
0.363
7.544
20.619
28.571
39.216
Concentration KI (moldm-3)
0.001
0.002
0.003
0.004
0.005
0.006
RESULTS 2
Concentrations for set: Varying volume Hydrogen Peroxide
Na2S2O3
0.025M
KI
M
H2O2
2 Volume
H2SO4
M
TRIALS:
Volume (ml)
H2O
72
70
64
69
64
59
66
56
Na2S2O3
2
4
0
0
0
0
0
0
KI
0
0
0
5
5
5
8
8
H2O2
0
0
0
0
5
20
0
20
H2SO4
5
5
5
5
5
5
5
5
Starch
Time (secs)
6
30
83
235
06
84
02
52
RESULTS:
2
3
4
5
6
7
Volume (ml)
H2O
71
66
64
62
60
58
56
Na2S2O3
0
0
0
0
0
0
0
KI
8
8
8
8
8
8
8
H2O2
5
0
2
4
6
8
20
H2SO4
5
5
5
5
5
5
5
Starch
Time (seconds)
Result 1
87
95
83
68
57
52
45
Result 2
83
95
75
61
56
52
46
Average Time
85
95
79
64.5
56.5
52
45.5
/TAVG
0.0054
0.0105
0.0127
0.0155
0.0177
0.0192
0.0220
/TAVG x103
5.405
0.526
2.658
5.504
7.699
9.231
21.978
RESULTS 3
Concentrations for set: Varying concentration H2SO4
Na2S2O3
0.25M
KI
M
H2O2
20 Volume
H2SO4
0.1M
TRIALS:
Volume (ml)
H2O
72
68
61
51
Na2S2O3
2
6
8
8
KI
0
0
0
0
H2O2
0
0
0
0
H2SO4
5
5
0
20
Starch
Time (secs)
24
261
81
RESULTS:
2
3
4
5
6
Volume (ml)
H2O
61
59
57
55
53
51
Na2S2O3
8
8
8
8
8
8
KI
0
0
0
0
0
0
H2O2
0
0
0
0
0
0
H2SO4
0
2
4
6
8
20
Starch
Time (seconds)
Result 1
13
01
03
97
95
97
Result 2
95
90
90
86
89
99
Average Time
05
95.5
96.5
91.5
92
98
/TAVG
0.009524
0.010471
0.010363
0.010929
0.01087
0.010204
/TAVG x103
9.524
0.471
0.363
0.929
0.870
0.204
Concentration H2SO4 (moldm-3)
0.005
0.006
0.007
0.008
0.009
0.010
Conclusions
From the graphs of Rate against concentration, I have determined that the reaction is:
Zeroth order with respect to [H+]
First order with respect to [H2O2]
First order with respect to [I-]
The overall rate equation is therefore:
Rate = k [ H+ ]0 [ H2O2 ]1 [ I- ]1
The reaction is therefore second order overall.
Error analysis:
Error introduced by temperature:
Although I endeavoured to perform the reactions at a constant temperature, due to fluctuations in room temperature this was largely impossible to achieve. A rise in temperature will have the effect of increasing the rate of reaction since the particles within the solution are given extra energy - the particles will have more collisions and since they have more energy they will have more chance of reacting. Each set was performed on a single day in an attempt to minimize these temperature changes, although temperature changes during a single session were inevitable.
Error in Volume measurement:
Each vessel used to measure quantities of chemical has its own error. Therefore in each final mixture of chemicals there would be errors in the volumes of each reagent collected. The percentage error can be calculated thus:
Maximum percentage error = smallest division on apparatus x 100
Minimum quantity measured for use
A 50ml biuret has an error of ? 0.05ml ?a maximum percentage error of 1.0%
A 250ml-measuring cylinder has an error of ? 1.0ml ?a maximum percentage error of ?2.5%
A 25ml-measuring cylinder has an error of ? 0.25ml ?a maximum percentage error of 2.5%
A 10ml-measuring cylinder has an error of ? 0.1ml ?a maximum percentage error of 1%
However, since in this experiment, the controlled variables are all in excess, the only error that will affect the results greatly is the error on the volume of the independent variable, known as the Critical error.
Timing Error:
1
The maximum time error = x 100
Smallest time measured
Which equals approximately 1/20 x100 = 5%
These errors seem surprisingly large, but in reality it will never really deviate this much since many of the times were well over a minute. As the time measured increases, the %age error will decrease.
Overall this range of error is not unexpected. It seems reasonable to assume that decisive conclusions may still be drawn from the investigation; despite the error introduced.
FURTHER INVESTIGATION:
Effects of Metal Ion Catalysts on the Rate of the Iodine Clock Reaction
Introduction to Catalysis:
A catalyst is a substance that alters the rate of a reaction without itself undergoing any permanent chemical change. A catalyst can provide a surface on which a reaction can take place (such as in enzymatic reactions) or a catalyst can provide a new reaction path that has lower activation energy - A catalyst does not supply any extra energy to the reaction. Because the catalyst does not itself undergo any permanent change, a small amount of catalyst is capable of catalysing an infinite amount of reaction.
Blue line represents energy profile for uncatalysed reaction
Red line represents energy profile for catalysed reaction
Transition Metal Catalysts
To predict whether a transition metal will work as a catalyst in the Iodine Clock reaction, we only have to examine the standard electrode potentials for each prospective catalyst and compare it with the values below; essentially if the Eo value for the catalysts reduction lies between 0.54V and 1.77V the catalyst may work.
I2 (aq) + 2e- - 2I- (aq) Eo /V = +0.54
H2O2(aq) + 2H+(aq) + 2e- - 2 H2O (l) Eo /V = +1.77
If the higher state of the catalyst will oxidise the substrate and the lower state of the catalyst can be oxidised by the product (?reducing the product), then there is a possibility that the catalyst will work.
The electrode potentials for the Transition Metals that I will use are:
Table 3.1
Reaction Eo /V
Fe2+ (aq) + 2e- - Fe (s) -0.44
Fe3+ (aq) + e- - Fe2+ (s) +0.77
Cu2+ (aq) + e- - Cu+ (s) +0.15
Zn2+ (aq) + 2e- - Zn (s) -0.76
Cr3+ (aq) + 3e- - Cr (s) -0.41
Mg2+(aq) + 2e- - Mg (s) +2.38
From this range of values I predict that Fe3+ and Fe2+ will work as catalysts in the Clock reaction. I know that although the Eo value for Fe2+ ions implies that the reaction will not occur, I understand that it occurs via a different reaction mechanism that I will outline in my conclusion.
In addition to the chemicals used in the previous part of the investigation, you will also require 15ml of the following aqueous solutions:
Iron (II) Chloride
Iron (III) Sulphate
Copper (II) Sulphate
Zinc (II) Sulphate
Magnesium (II) Sulphate
Chromium (III) Nitrate
Method
(1). Collect in a conical flask 165ml of distilled water, 1ml of 1% starch, 4ml of Hydrogen peroxide (2 Volume).
(2). In a second conical flask collect 5ml Sodium Thiosulphate (0.025M), 6ml Potassium Iodide (1 Molar) and 20ml Sulphuric Acid (1 Molar).
(3). Mix together contents of flasks into one 250ml conical flask (simultaneously start a stopwatch) and swirl above a white tile.
(4). Time the reaction to its end point, and record.
(5). Repeat steps 1 to 4 except this time adding 5ml of one of the metal ion catalysts to the mixture; repeat the experiment for each of the catalysts - taking repeat results.
The metal ion catalysts that work should show a massive increase in reaction rate over the standard reaction (i.e. the reaction without any catalyst).
Results:
Catalyst Used
Average Reaction Time
Uncatalysed
94
Zn2+
90
Mg2+
90
Cr3+
88
Cu2+
0
Fe3+
6
Fe2+
2
Conclusions:
The transition metal ions Cu2+, Fe3+ and Fe2+ will all catalyse the iodine clock reaction.
This does not agree with my prediction. I will now try to explain this:
The viability of these catalysts in this role within the iodine clock reaction may be explained in terms of their electrode potential values. To explain this I will use the concept of "anticlockwise arrows".
Considering the oxidation of Iodide ions, catalysed by Fe3+ ions.
The Eo values for this reaction are:
Fe3+ (aq) + e- - Fe2+ (s) Eo /V = +0.77
And
H2O2(aq) + 2H+(aq) + 2e- - 2 H2O (l) Eo /V = +1.77
I2 (aq) + 2e- - 2I- (aq) Eo /V = +0.54
The reaction which has the most positive Eo value (i.e. the strongest oxidising agent) will proceed as written, the other reaction will occur in the reverse to the way it is written. This can be shown diagrammatically as:
I2 (aq) + 2e- - 2I- (aq) Eo /V = +0.54 Fe3+ (aq) + e- - Fe2+ (s) Eo /V = +0.77
The following then occurs:
Fe3+ (aq) + e- - Fe2+ (s) Eo /V = +0.77
H2O2(aq) + 2H+(aq) + 2e- - 2 H2O (l) Eo /V = +1.77
Hence the catalyst, Fe3+, is regenerated.
According to this rule Zn2+, Cr3+, Fe2+ and Cu2+ would not catalyse the oxidation of Iodide ions since they are not strong enough oxidising agents. However it is possible that Fe2+ worked using this reaction path:
Fe3+ (aq) + e- - Fe2+ (s) Eo /V = +0.77
H2O2(aq) + 2H+(aq) + 2e- - 2 H2O (l) Eo /V = +1.77
Iron (II) ions are initially oxidised by the Hydrogen Peroxide, which creates water and Iron (III) ions:
I2 (aq) + 2e- - 2I- (aq) Eo /V = +0.54 Fe3+ (aq) + e- - Fe2+ (s) Eo /V = +0.77
The Iron (III) ions then oxidise Iodide ions back to iodine whilst regenerating the catalyst.
Despite the Eo value suggesting that Fe2+ will not function as a catalyst, the reaction steps simply occur initially in a different order.
To explain the fact that Cu2+ ions worked as a catalyst:
When considering tabulated electrode potential values one must keep in mind that for the published values it is assumed that the ions are in aqueous solution in their aqua-complex, and that the values are performed at exactly STP. If these ions are bonded differently or have a different ligand in place of the aqua group then the Eo value will be altered dramatically. It is therefore possible that the Eo value of Cu2+ was changed so much by the temperature in the laboratory and the presence of non-aqua ligands that it enabled these ions to catalyse the reaction by increasing their oxidising power. It is more likely that the Cu2+ ions formed a complex with iodide ions which accounts for this change in Eo value - perhaps the complex [CuI4]2-.
Mg2+ ions, Zn2+, and Cr3+ ions did not function as catalysts since their Eo values lie outside the range defined by the Iodine clock reaction, 0.54V --> 1.77V.
Bibliography:
"A-level Chemistry" (3rd Edition) E.N. Ramsden .................Stanley Thornes 1995
"Chemistry by Concept" Anthony Spiers, Derek Stebbens ......Heinemann 1973
"Chemistry in Context" Graham Hill, John Holman...............Nelson 1989