1.2 - References
- “Sand dunes: a practical investigation guide” – Tim Stott, James Hindson and Robin Crump.
- “Sand dunes: a practical investigation guide” – Tim Stott, James Hindson and Robin Crump.
- “Sand dunes: a practical investigation guide” – Tim Stott, James Hindson and Robin Crump.
- “The Wild Flowers Of Britain And Northern Europe.” – R. Fitter and M. Blaney
- “A New Key To Wild Flowers” – J. Hayward
2. - Method
The site I used was at Broomhill Burrows. (SR 883 002). First I used a compass to determine which direction which direction was north and which direction was south. I found a suitable sand dune which had a sufficient amount of A.arenaria on both its north and south facing dunes and started on the north side. I set out a 10m x 10m grid using two tape measures making sure it was on a suitable part of the dune. Then using a calculator I generated random numbers to use as co-ordinates and left a marker at the first co-ordinate before going to the second co-ordinate. Where the two co-ordinates met I placed down a 0.5m x 0.5m string-less quadrat with one side parallel to the tape on the x axis, taking care not to trample on any of the plants with my feet or the quadrat. Then I gathered bunches of the A.arenaria and measured the longest blade of each plant with a 1 meter ruler to the nearest millimeter and recorded the measurement in the data sheet and calculated the cumulative mean each time. As the cumulative mean began to level out I worked out the 5% confidence interval, which is the level used in ecology, so I would know the upper and lower boundaries that my mean should stay within. I carried on taking results until I had doubled the number of samples taken as the mean started to plateau. Doing this ensured a fair representative sample of the A.arenaria. After the north side was completed the same procedure was carried out on the south facing side of the dune taking care to ensure all variables were controlled like the distance from the sea, the size of the grid and the degree of accuracy. In field work it is difficult to control all variables but the two sites identical in terms of their, age, size and level of vegetation.
In addition to this I also decided to take some abiotic data. I measured light intensity using a light intensity meter at 1 meter off the ground from a random co-ordinate on the grid. Temperature was taken at ground level using a whirling hydrometer. Wind speed was also measured at ground level using an anemometer. Soil samples were taken by pushing a 10cm3 tube into the ground and removing the soil. This was then placed in a polythene bag so none of the moisture was lost before it could be tested. The pH of the soil could also be tested from this sample.
All these measures were carried out on both north and south sides of the dune.
3.0 - Summary Table Of The Length Of A.arenaria On North And South Facing Dunes
From the summary table and trend graph there is a trend showing that the length of A.arenaria is longer on the south side than the north side of the dune. There is a difference of 200mm between the longest blade found on the south side and the longest blade found on the north side. There is very little overlap between the lengths found on the south side and the lengths found on the north side. This clear difference supported the predictions made in my plan.
3.1 - Stats Test : Student ‘t’ Test
Hypothesis: - There will be a statistical difference in the height of the A.arenaria on north and south facing dunes.
Null Hypothesis: - There will be no statistical difference in the height of the A.arenaria on north and south facing dunes.
North side of dune
Standard Deviation – 71.95
Mean - 845.13
South side of dune
Standard Deviation –73.32
Mean – 1049.10
A ‘t’ test is used for a difference between the means of two sets of data.
n1 = 60 n2 = 58 SD1=71.95 SD2 = 73.32
Mean1 = 845.13 Mean2 = 1049.10
t = 203.97
15.06
t = 13.54
Degrees of freedom = (n1 -1) + (n2 – 1) = 116
P = 0.05
Critical Value =1.9
t = 13.54 at a confidence level of 5%, probability of 0.05 and at 116 degrees of freedom.
Since the ‘t’ value is higher than the critical value at a confidence level of 5%, probability of 0.05 and at 116 degrees of freedom. Therefore the null hypothesis must be rejected and I must accept my hypothesis that there is a statistical difference between the length of A.arenaria on north and south facing dunes.
3.2 - Anomalies
No anomalies were evident in the results obtained. The cumulative mean calculated helped in insuring this as it was calculated in order to get results representative of the whole population and that enough samples were measured. There were some natural fluctuations which are common in ecological studies.
4.0 – Abiotic Data
This table shows that the temperature was slightly higher on the south facing side. The wind speed was the same and the light intensity was 1.06LUX higher on the south side.
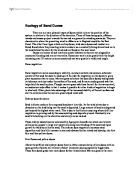
5.0 Discussion And Evaluation
The results from the graphs and summary table show that there is a clear difference between the length of the A.arenaria on the north facing side and the south facing side of the dune. The mean length of the south facing side is noticeably longer than on the north facing side of the dune.
On the north facing side of the semi-fixed dune the abiotic data and my observations suggest that there was less light available to the organisms living there. This meant that the plants were receiving less energy from the sun to use in respiration and growth. There was also less interspecific competition as few otherplants could
At any one time the dominant species will be the plant best adapted to its surroundings.
Neither side was directly facing the sea so that should not of be a factor<explain more here>
Abstract
The aim of the investigation was to investigate the differences in height of A.arenaria on north and south facing dunes. The hypothesis tested was that there would be a statistical difference in the height of the A.arenaria on north and south facing dunes.
The investigation was carried out at Broomhill Burrows, Fresh Water West during September 2003. The height of the longest blade of A.arenaria was measured in random locations within a 10x10m grid on the north and south facing sides of a dune. These were then statistically compared using a students ‘t’ test. This showed that there was a statistical difference between the height of A.arenaria on north and south facing dunes at the 5% confidence level.