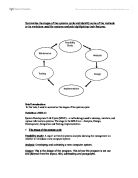
Fig. 1 An example of a data flow diagram.
It also focuses on the processes that transform incoming data flows (inputs) into outgoing data flow (outputs). The process which are made, both create and use data and are held within data stores. Data flow diagrams allow the user to visualize how the system will operate, what the system will accomplish and how the system will be implemented. Data flow diagrams are also one of the three essential perspectives of Structured Systems Analysis and Design Method . The sponsor of a project and the end users will need to be briefed and consulted throughout all stages of a system's evolution. With a dataflow diagram, users are able to visualize how the system will operate, what the system will accomplish, and how the system will be implemented. The old system's dataflow diagrams can be drawn up and compared with the new system's dataflow diagrams to draw comparisons to implement a more efficient system. Dataflow diagrams can be used to provide the end user with a physical idea of where the data they input ultimately has an effect upon the structure of the whole system from order to dispatch to report. How any system is developed can be determined through the use of a dataflow diagram.
Advantages include the following:
- A data flow diagram indicates the direction of data and information within the system.
- Data flows provide a link within the system to other symbols within the data flow diagrams. Data flow diagrams can show external entities that interact with the system.
- It also shows clearly the process that happens
- It shows the data stores that are used within the system.
- It shows a clear flow of data and information.
Disadvantages of data flow diagrams are simply that it will clearly not show what hardware and software is used.
Perfect Pie and Data Flow Diagrams
Data flow diagrams can be used within the Perfect Pie Scenario because it will easily allow the analyst and system-users to visualize how the new system will operate. It will allow them to ensure the system accomplishes what they need and want. It will also show how the new system will be implemented.
Decision Table
Decision tables are a precise compact way to model a complicated logic. Decision tables, like if-then-else and switch-case statements, associate conditions with actions which will turn into a performance. But, unlike the control structures found in traditional programming languages, decision tables can associate many independent conditions with several actions in a well-designed way. Decision tables are divided into four quadrants, and each decision flowing through corresponds to a variable, relation or a predicate, in which their possible valuables are listed among the condition alternatives. Each action within the decision table is a procedure to perform, to specify the action is to be performed for the set of conditions alternatives the entry corresponds to. Most decision tables include in their condition alternatives a hyphen. The use of the hyphen symbol within a decision table can simplify the information within the table, especially when the given condition has little authority on the actions to be carried out. Although initial information that is thought to be of an importance can easily be found out to be totally irrelevant as a condition within the decision table. Decision tables vary widely in the way condition alternatives and action entries are represented. For example other decision tables can use true or false, number alternatives, fuzzy logic or probabilistic representations. Although action entries can represent whether an action is to be performed, or in more advanced decision tables, the sequencing of actions to perform. A Decision table can be used if a combination of conditions is given. In decision table conditions are known as causes and seminal numbers of conditions are known as business rule.
The following is a list of advantages associated with decision tables:
- Decision tables are very easy to understand, for example, they can map nicely together to create a set of business rules.
- Decision tables can be applied to real problems, for example analysis of the current system used within an organization.
- Through use of a decision table, no prior assumptions can be made about/from the data, leaving other methods available or open for discussion.
- Decision tables allow users to input and process both numerical and categorical data.
The following is a list of disadvantages associated with decision tables:
- In order for a decision table to be of any value as an analysis tool, all outputs within the decision table must be categorical.
- Not only must the output be categorical but there can only be one limited output.
- Creating a decision table from numeric datasets can be a complex operation.
Perfect Pie and Decision Tables
The Decision Table as an analysis tool within the Perfect Pie Scenario would not be suitable, since it would be non-beneficial. Although Decision Tables are very easy to understand, if one output in the decision was not categorical, it would be of value to the analysis of the current system, making the current process a waste of time.
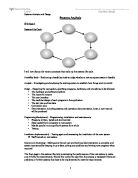
1.4 Entity Relationship Diagram
An ERD is a model that identifies the concepts or entities that exist in a system and the relationships between those entities. An ERD is often used as a way to visualize a relational database: each entity represents a database table, and the relationship lines represent the keys in one table that point to specific records in related tables. ERD’s may also be more abstract, not necessarily capturing every table needed within a database, but serving to diagram the major concepts and relationships. This ERD is of the latter type, intended to present an abstract, theoretical view of the major entities and relationships needed for management of electronic resources. It may assist the database design process for an e-resource management system, but does not identify every table that would be necessary for an electronic resource management database. ERD’s are made up of entity’s, is an object in which you want to store information, a weak entity, these are the attributes and properties of the object, a key attribute, is the unique distinguishing characteristic of the entity, For example, an employee's social security number might be the employee's key attribute, a multi-valued attribute, will allow the ERD to have more than one value. For example, an employee entity can have multiple skill values; a derived attribute is based on another attribute. For example, an employee's monthly salary is based on the employee's annual salary, and lastly relationships, they illustrate how two entities share information in the database structure.
The following states the advantages of ERD’s:
- They can be easily explained to non-technical users and sponsors of a proposed system. Most business people can easily validate the important entities, their identifying attributes, and the rules that define the relationships between the entities in their real world.
- ERD’s are very easily translated from their logical representation to a preliminary physical design of a relational database. It is, after all, a relational technique.
- ERD’s can scale to show the total information model of an entire enterprise or a restricted view can present just the subset of entities of interest to a particular system. This allows enterprise data architects a wonderful way to "zoom" in and out to examine global relationships or detailed implications of a proposed change in one particular program.
The following states the disadvantages of ERD’s:
- It is primarily a data-focused methodology and doesn't attempt to model the processing needs of the application.
- Processing will have to be designed to support each relationship, but the ERD doesn't suggest how that processing will be handled.
- ERD’s require a complementary design and documentation technique to handle processing needs and module decomposition.
Perfect Pie and ERD
An Entity Relationship diagram can be used as an analysis tool within the Perfect Pie Scenario, because it will analyze the Perfect Pie Company as a whole, therefore allowing both employers and employees to easily take all the information about the proposed system on board. There is no technical knowledge required. All attributes within an ERD can easily be translated from their logical representation to a preliminary physical design of the new proposed system. This will be a good effective analysis tools because non-technical experience is required and both the analyst and the organization can get a visual view of the new system.
Flowcharts
A flowchart is common type of , which represents an or , showing the steps as boxes of various kinds, and their order by connecting these with arrows. Flowcharts are used when analyzing, designing, documenting or managing a process or program in various fields. Flowcharts are used in designing and documenting complex processes. Like other types of diagram, they help visualise what is going on and help the viewer to understand the process, and perhaps also find flaws, and other less-obvious features within it. There are many different types of flowcharts, and each type has its own range of boxes and conventions. Most Flow charts consist of two types of boxes in a flowchart which is: a processing step, usually called activity, and denoted as a rectangular box and a decision, usually denoted as a diamond. Flowcharts also depict certain aspects of processes and they are usually complemented by other types of diagram. Flow charts are a good way to illustrate.
A Flowchart shows the following:
- It shows tasks to be carried out both manual and computerised.
- Any Input/Output sued in proposed system and media.
- Structure of all files in new system (hierarchy).
The following states the advantages of Flowcharts:
- They are a more effective way of communicating the logic of the system to all concerned.
- Flow charts also allow problems to be analysed in a more effective way.
- They serve as good programme documentation, which is needed for various purposes.
- They act as a guide or blueprint, during the system analysis and programme development phase.
- They help in the debugging stage of the current system.
- Through the use of flowcharts a programmer will easily keep a programme maintained.
The following states the disadvantages of Flowcharts:
- They can be quite complex and overall quite complicated.
- If the flowchart needed alteration, the current design might need to be redrawn. As the flowchart symbols cannot be typed out on the computer, total reproduction of the flowchart will become an obstacle. The essentials from a flowchart of what is being done for example the technical details, can be lost.
Perfect Pie and Flowcharts
Flow charts can be used as an analysis tool within the Perfect Pie Scenario because it will communicate the logic of the new system a lot more effectively. It will also allow all problems within the proposed system for the Perfect Pie Company to be easily analyzed.
Problem Definition
A problem definition is the first stage of the S.D.L.C, which is then preceded by informal discussions, in which the client will outline his or her requirements for the design of the new system to the system analyst. Problem definitions will always include a ‘terms of reference’ so the analyst can easily refer back to it for clarification. All problem definitions must include what the proposed system must achieve, different objectives should be taken on board, for example, the reduction of running costs, improved customer service (customer satisfaction at 100%) and lastly better mgt information, this will drastically improve decision making processes. The proposed system will come with restraints also, for example, the money available for the design of the new system (budget), and areas that mightn’t need any improvements. All reports about the problem definition need to be documented, and clearly listed, for example, reports need by the administration staff, with any other outputs required. All problems with current system must be listed.
The following states the advantages of Problem Definitions:
- Both user and analyst are thinking of a solution for problems within the proposed system.
- All problem definitions include ‘terms of reference’ which can be easily looked back on.
The following states the disadvantages of Problem Definitions:
- The process is very time consuming and the organizations budget could be decreased because of this i.e. financial risk.
Perfect Pie and Problem Definition
Problem Definition can be used as an analysis tool within the Perfect Pie Company. Although there are financial risks involved with the process, which may prove risky for the Perfect Pie Company, it is still a good analysis tool because both user and analyst can sit down together and draw up solutions for problems within the current/proposed system.
Conclusion
From looking at the various Analysis tools on offer, the most appropriate methods for the new system for Perfect Pie are Problem Definition, ERD, Data Flow Diagrams and Flowcharts.