Another thing which I do not like about this table is that it does not show whom I am asking so that I do not know if I am asking a boy or a girl so I cannot find out the information about the hypothesis on boys and girls. Because I don’t have the names written down I can forget whom I have asked and whom I haven’t so it is confusing.
This is the second trial for collecting the results. This time I have a table, which contains all of the extra information that I need. I have used the mistakes in the last table to alter them and correct them to come up with a new table, which collects more accurate results and gives me more information. This table tells me the names of the people that I am asking, which sets they are in and weather they are male or female. In this table, rather than making a tally, I have to record the actual results that I get told by the person that I am asking. If I need to make a graph e.g. a histogram, then I can collect the information like the last table to give me groups of values to work with. This new way of collecting the data is much more accurate because it tells me exactly what the person I asked said rather than have it all in groups using a tally.
The table above is how I have decided to collect my results. It is neat, well set out and gives more information than the other one. It gives more accurate information as well. It is easy to do and conduct. This table shows me the name of the person that I am asking, the set they are in so I will know where to go and weather they are male or female to quickly look over and take out results of males and females. The other big improvement that I have made from the last table is that I have put them two into one table so I can record all of my results just on this one table rather than having to look at two tables. This makes it much easier to record my results and too look over and compare results. In the last table it is not possible to do that because the angles are measured in degrees and the lines are measured in centimetres.
Calculating the number of students to ask
Now that I have decided how to collect my results, I need to see who I will ask. To do this I need to first work out how many people I will ask in each set. This is stratified sampling. Below is a table showing how I have worked this out.
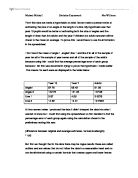
The table above shows the formulas that I typed into Excel to give me the answer to the number of pupils I need to ask. Basically to find out the number of pupils I need to do I have to use this equation:
No. Of pupils in set X No. Of pupils being asked = No. Of pupils to ask Total No. Of pupils
For example to find out the number of pupils I will ask in set 1 I need to do this:
30 X 20 = 5
120
Below is the table of the results that I have obtained, which shows the number of pupils that I need to ask.
Because the results obtained above are mainly in decimal places, I will need to round up the numbers. Below is another table showing the number of pupils that I will need to ask but this time rounded up because it is impossible to ask 4.8 pupils.
Collecting Information
Now that I have found out how many people I will need to ask in each set I have collected all of the information that I need to. I have chosen the people listed below by picking names out of a hat as explained at the beginning.
Below is the table that I have decided to use to collect my information. This table is very ideal because all of the information is on one table and it is easy to read and look over. I have used a sample of twenty students because that will give me eighty results, which is enough to prove my hypothesis.
Now that I have collected all of this data, the next thing that I need to do is to organise the data into different tables to see if my hypothesis is true. I need to do this so that I can easily look at the data that I need to e.g. different list of boys and girls. I will also need to draw some graphs to shows this information in other ways and to see if my hypothesis is correct.
Now that I have my results I need see if my first hypothesis is true. To do this I need to find out the average length of the line and the average size of the angle. I will compare them by using 1 millimetre to 1 degree. Below is a table showing the results I got and the cumulative frequency which I will use to add up the results. Then I will need to find the mean which is recorded on the bottom of the table. To work out the mean, I will need to find out the total of each column and then divide it by 20. The reason that I am using cumulative frequency is to find the total of each row. The formula for finding the mean is:
Total of the records obtained
Number of records obtained
For example to find the mean of Line 1:
165.4 = 8.27cm
20
Now that I have found out the mean of each of the two lines and two angles, I need to see if my hypothesis was correct. I will do this by comparing the results of the angles and the results of the lines. I will compare the results by using 1 millimetre to 1 degree.
Line one was 8.7 cm and the mean that I got was 8.27cm. That is a difference of 43mm.
Line two was 5.3cm and the mean that I got was 4.79cm. That is a difference of 51mm.
Angle 1 was 37º and the mean that I got was 44.5º. That is a 7.5º difference.
Angle 2 was 63º and the mean that I got was 67.65º. That is a 4.65º difference.
Looking at the results, I can see that my hypothesis was incorrect because the size of angle was guessed better than the size of the line. This could be because the comparison of 1 millimetre to 1 degree is not a very good comparison. It could also be because I chose the mean. Maybe the results would have been different if I used the mode or median or standard deviation. The reason which I chose to use the mean is that it takes in account all of the results that I obtained.
Now I will need to design a new table to easily compare the boys and the girls. Then I will need to find the mean to see if my hypothesis is true.
In the last page is a table that shows what I did to find the mean of lines 1 & 2 and angles 1 & 2 of the boys. It has a column for cumulative frequency because I need to add up all the results to find the mean. Below is a similar table but this one is for the mean of the girls.
Now that I have obtained both the mean results of the boys and the girls, I will need to compare them to see if my hypothesis is true.
Line 1 was 8.7 cm. The mean for the boys was 8.66 cm which is a difference of 0.04 cm. The mean for the girls was 7.88 which is a difference of 0.82 cm.
Line 2 was 5.3 cm. The mean for the boys was 5.13 which is a difference of 0.17 cm. The mean for the girls was 4.45 which is a difference of 0.85 cm.
Angle 1 was 37º. The mean for the boys was 42.2º which is a difference of 5.2º. The mean for the girls was 44.8 which is a difference of 7.8º.
Angle 2 was 63º. The mean for the boys was 65.6º which is a difference of 2.6º. The mean for the girls was 69.7 which is a difference of 6.7º.
These results show that the boy where only slightly better at guessing both the length of the line and the size of the angle. The results were very close which shows that neither the boy nor the girls guess better than one another. It could have been a coincidence that the boys were guessing a bit better than the girls. This shows that my hypothesis saying that neither boys nor girls would guess better than one another is true.
Now that I have proved the boys and girls hypothesis is true, I need to use standard deviation for the size of angles and the length of lines hypothesis. I will use standard deviation because it is a better comparison between angles and lines.
To find the standard deviation I will need to follow these five steps.
- Find the mean (which I have already done)
- Find the difference between each data value and the mean
- Square the deviation from the mean and add
- Divide the total by the number of data values
- Find the square root of that
The formula for standard deviation is:
_______
√∑(X – V) where V= the mean
n
The easiest way for me to find the standard deviation is to draw a table. The table will need to show all of the working out and everything that I will need to do to be able to get the standard deviation.
On the next page is a table which shows the table that I used to get the standard deviation. It does everything up to step three on the standard deviation. Steps four and five are done and explained below the table.
This table shows every thing up to step three. Now I will need to do step four and five separately.
Line 1
________ ______
SD= √26.062/20 = √1.3031 = 1.14 to 2 d.p
Line 2
________ ______
SD= √14.858/20 = √0.7429 = 0.86 to 2 d.p
Angle 1
_______ _____
SD= √1649/20 = √82.45 = 9.08 to 2 d.p
Angle 2
__________ _______
SD= √1820.55/20 =√91.0275 = 9.54 to 2d.p
As the standard deviation is smaller, the results are closer to the actual number. The standard deviation that I have obtained shows that people did guess the length of lines much better than the size of the angle because the standard deviation for the length of lines was much smaller than it is for the size of the angle. This shows that my hypothesis was correct and that it is better to use standard deviation than it is to use the mean. It would also be better than using the mode and the median because unlike them, standard deviation takes in account all of the results that have been obtained. This also shows me that the comparison of 1 mm to 1 degree is not a very good comparison as it showed me the opposite to what standard deviation did. So in conclusion, both of my hypotheses were proved to be true by using the mean and standard deviation as they both take in account all the results so they are the most accurate. Standard deviation is more accurate than using the mean. Although they are both taking in account all of the results, standard deviation allows you to compare any two or more things with different units e.g. centimetres and degrees. Standard deviation does not have a unit so it is much more accurate to compare than it is to the mean. With the mean you have to compare the units and it is very hard when the units are not comparable e.g. centimetres and degrees. When using the mean you will be obliged to make a comparison for the two results like the 1mm to 1º comparison I made. Sometimes these comparisons can be very inaccurate like I have discovered which gives wrong results. That is why it is better to use standard deviation for comparison that it is to use the mode, median, mean, range or inter quartile range.