Although these results do not tell us whether or not people over or under estimate angles and lines, it does tell us that on the whole people excel in estimating angles rather than lines. This difference suggests that there is something worth investigating further.
The data we had already collected however was not sufficient to draw a firm conclusion from, as it was only our age group and in the top set. We widened our search for data and asked the whole of year ten, the whole of year seven and some adults working at our school. We asked each person taking part to specify their age group, (year 7, year 10 or adult) their gender, (male or female) and their maths set, (1-5). This wider availability of data would enable us to draw a firmer conclusion and create more hypotheses to investigate and prove either correct or incorrect.
Once the data had been collected from year seven, year ten and 68 adults the data was entered onto a computer database, in Microsoft Excel. An example of the way we used this can be seen on page 17, this was to make it easier to interpret our results. We continued with the original hypothesis by taking 25% of the 178 pupils in year 10. We used our calculator on the random number generator to randomly select the people not stratifying in accordance to gender or set. We then looked at whether they stood out to be better at estimating lines or angles.
35% of year 10 gave us 45 pupils to look at, we used the computer to calculate the % error for each pupil and then took an average for each line and angle.
This bar chart shows that our year 10 top set was quite typical of the whole of year 10, although as the fact it is a top set would indicate it shows they are slightly better. It shows me that year 10s are better in general at estimating angles than lines, although acute angles and long lines puzzle them more than obtuse angles and short lines, which is surprising as it shows that there isn’t a link between the size of something, e.g. small things are easier to estimate whether it is a line or an angle.
I then moved onto investigating the same hypothesis with a cumulative frequency graph which will tell me for each estimation how many of the people in my year 10 sample were within 10% of the real value, (5% either side). This will then tell me which one that people were nearest to.
On the next page is an example of the table I used to work out the cumulative frequencies and also the cumulative frequency graph I drew. I haven’t enclosed all four graphs but on the next page is a table showing the data you would find on them.
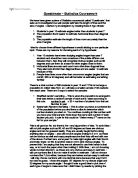
Angle one
This cumulative frequency graph shows us that 7 people out of 45 would be within 10% with their estimate of angle one. This is 18% of year 10 students. The probability someone would be within 10% of the real value for angle one when they estimated it is 9/50.
(NB Line 1 only has 44 people as one was an obvious outlier and differed from the rest of the values by 9cm. Line 2 only has 43 people as two were obvious outliers.)
These results back up what our bar charts of percentage errors tell us. That people were better at estimating shorter lines and larger angles. It gives us the following statements:
- People have a 18% chance of being within 10% of the true value of angle one
- People have a 33.3% chance of being within 10% of the true value of angle two
- People have a 13% chance of being within 10% of the true value of line one
- People have a 7% chance of being within 10% of the true value of line two
This also tells us that year 10s are better at estimating angles than lines which brings me to my second hypothesis.