Therefore a value added to x² translates the graph up or down on the y-axis.
A different form of the quadratic function is to put it into a perfect square. A perfect square is an equation where the square root to the whole of one side is taken to get the answer on the other side.
eg:
y = (x + b)²
This is a perfect square where if the square root of ‘x + b’ was taken then the answer to ‘y’ would be established.
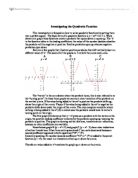
Here are some graphed examples of perfect squares:
D E F
y = x² y = (x – 2)² y = (x + 3)²
A noticeable pattern is seen as the vertex of these parabolas shift from left to right on the x-axis. Now that the value being added is directly linked to the x value the position of the vertex changes on the x-axis, as this is the value being changed. If a value is added to ‘x’ the parabola moves to the left and the value on the x-axis is negative. To prove this I am going to use the function in graph F:
The graph shows the x value to be –3 whereas the value being added to x is +3.
I am simply going to work out the equation by moving the numbers to the other side to leave x alone- y = (x + 3)²
y = x² + 9
√-9 = √ x²
-3 = x
So we see that positive values added to x will always end up negative therefore the opposite, all negative values, will show positive values on the x-axis for the parabola.
If the form ‘y = (x + b)²’ is modified to ‘y = a(x + b)² + c’ this is now “turning point form”. We already established that adding values to x² will move the vertex of a parabola up and down the y-axis. We also recognized that adding a value directly to x would move the vertex left or right upon the x-axis. In this form we are dealing with both of these generalizations, we are adding directly to x and adding to x² as well so now we will be given an x and y value for the position of the vertex.
Here is an example of a function in turning point form:
G
y = (x – 4)² + 5
Using what we learned from the first two forms we can work out where the vertex is going to be before we see it on a graph. We established that any negative numbers added directly to x would move the vertex that value to the right, we also worked out that adding a value to x² would move the vertex up that amount. So now we combine the two. The number added directly to x is –4, so it will move 4 units to the right, combined with moving up 5 units would give us the coordinate (4, 5). This is where the vertex is located on the graph.
So when the form ‘y = a(x + b)² + c’ is given the graph will move ‘b’ units to the right (left if it is positive) and c units up (down if it is negative) which is where the vertex will be located for that graph.
The basic quadratic equation ‘y = ax² + bx + c’ can be changed into turning point form to make it easier to find the vertex and the shape of the parabola. Eg:
If we have the equation ‘x² - 10x + 25’ and we want to change it to the form (x – h)², a perfect square, this method can be used:
Divide 10 by 2, this will give us -5. Now plug this into the equation so that the x and the 5 are in brackets and all squared so the new equation will look like this: y = (x –5)² + 25
But now that 25 is being added in the brackets (-5² = 25) 25 has to be subtracted as well so now the equation will look like this: y = (x – 5)² +25 – 25
y = (x – 5)²
The value that was being added to x² as a whole was eliminated so this answer is now in a perfect square and taking the square root of the right side would give us values for x.
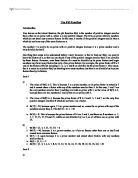
Similar to the previous calculation trying to work out y = x² - 10x + 32 into turning point form would give us slightly different results. Notice that the value for ‘c’ in the form has changed from 25 to 32.The only difference is that the 25 would not be eliminated this time, as the value has now changed to 32 and 32 – 25 = 7 so now the answer will be y = (x – 5)² + 7. The only difference being the added 7, which will give us a y-value for the graph. Here is a graph of the two parabolas. The red curve is the first one and the blue curve is the second equation.
H
y = (x – 5)²
y = (x – 5)² + 7
Notice how the line moves from 0 to 7 into the second curve as the 7 is added to the equation. It clarifies even more how adding a value to x² moves the parabola up that amount.
Here are some more examples of this procedure:
1) y = x² - 3x - 4
= (x - 3/2)² - (3/2)² - 4
= (x - 3/2)² - 25/4
2) y = x² - 20x + 64
= (x –10)² +64 + 100
= (x –10)² + 164
3) y = x² -8x +17
= (x – 4)² +17 +16
= (x – 4)² + 33
To write the quadratic expression in the form (x – h)² + g first the equation must be translated from the general form x² + ax + b to the form (x – h)² + g. In order to find ‘h’, you divide the coefficient ‘a’ by two, now take this value and put it into the equation (x – h)² + g. Now square the value of h and add that to the value of g.
Here are the steps:
- a/2
- replace ‘h’ in (x – h)² + g with value from previous step
- square ‘h’ and add that to ‘g’
Now that we know that in the form y = (x – h)² + g, (h, g) is going to be the coordinate of the vertex. This is because any number added or subtracted directly to x will effect wheather the vertex moves left or right and any number added to the square of x will affect the vertical movement of the vertex. A general shape of the parabola can now be found using substitution with the values that we have already found. Insert the values for h and g that we found using the method mentioned earlier on and substitute 0 for x as we are trying to find the y-intercept. Thus the y-intercept = -h² + g. It will be a positive parabola as the x² is positive so the parabola will open upwards.
So to get the basic shape of a parabola first find the vertex by moving ‘h’ to the right and ‘g’ up, then substitute ‘0’ for ‘x’ and work out what ‘y’ will be to get the y-intercept. Once the y-intercept is found a curve can be drawn from the vertex to the y-intercept and since the line is a reflection through the line of the vertex the other side of the parabola can be draw as well.
Some of the rules that apply to all the forms discussed in this investigation also apply to other forms. To translate a linier function on the y-axis you add or subtract a value directly to x just like mentioned before. The slope will stay the same but the interception of the y-axis will be different as the value implied on x changes.
y = 2x
y = 2x + 6
Observe how the blue line shifts its y- intercept as 6 is added to the equation
If x is raised to any even number the parabola will observe the exact same rules as x².