My aim is to find out if there is :a) Any correlation within the two County divisions (in both one day and 4 day matches) b) Any overall correlation within both leagues, with all types of bowlers included.
Statistics Coursework Maths UF 2003 By Jack Palmer Introduction I was playing in a cricket match last week, and was wondering why spin bowlers seem to concede a lot more runs than the quicker bowlers, but also take a lot of wickets. I wondered if a similar thing happened in the professional Frizzell County Championship and the Norwich Union League (One Day). I was therefore wondering if the number of wickets taken by a bowler affected their economy (Runs/Over). Aim My aim is to find out if there is: a) Any correlation within the two County divisions (in both one day and 4 day matches) b) Any overall correlation within both leagues, with all types of bowlers included. Plan * Secondary Data * Use systematic sampling (1 player in every 5) * Create box plots and plot cumulative frequency of wickets taken & economy (Runs/Over) * Sampling Frame = All players who took a wicket in the 2002 cricket season in either 1-Day or 4-Day matches * I will collect all of my data from a reliable source: http://www.ecb.co.uk/ Prediction Although I do not know what the outcome of this coursework will be, I can predict, using past knowledge and common sense, that the more wickets a bowler takes, the lower their economy will be. This is mainly because taking a wicket purely reduces the chances of runs being scored off the bowler. Before I started to use my results to plot a

"The lengths of lines are easier to guess than angles. Also, that year 11's will be more accurate at estimating."
In this investigation, 3 year groups - years 9, 10 and 11, were asked to estimate the lengths of some lines and angles, and the results that the pupils produced are going to be analysed to try and prove or disprove the hypothesis of: "The lengths of lines are easier to guess than angles. Also, that year 11's will be more accurate at estimating." The reasons I think these things are because people are more used to seeing lines than they are angles, so this could mean that they are better at estimating the length of lines. The reason I think they year 11's will be more accurate is because they have done maths longer than the year 9's, so they have had more experience. I will be using an example of one line, and one angle, and the results of Year 9 and Year 11 estimates. This is secondary data which has been previously recorded, during a survey to find out the estimates that the pupils gave. This data is continuous as it is As there are 117 year 9's and 145 year 11's I will have to reduce the size of my sample as these numbers are too large to handle, so I will be using a stratified method to reduce the size of the samples as this method keeps the results for the year groups in proportion to each other. I am going to be sampling 60 people in total, out of the year 9's and year 11's, as this is a manageable amount, and it can represent the data from the two year groups
Investigatings heights of girls and boys in year seven.
Statistics Coursework When standing at the station waiting for my bus home, I noticed some year seven boys from St Olaves introducing themselves to one and other. They were talking to each other about their experiences of their first week at a new school when I noticed that they were a lot smaller than I remember myself and my friends being in year seven. I then began to think about general heights of boys and girls, wondered if girls were always taller than boys. I decided to investigate this. I predict that girls in year seven will be taller than boys in year seven. I will attempt to either disprove or prove my hypothesis by taking the averages of heights of a sample of year seven boys and a sample of the year seven boys. The Data I am using is Secondary, as somebody else collected it, for me. The fact that this data is Secondary can leave me with some problems. When collected the data, people may have forgotten to take their shoes off. They may have also measured in feet and inches and translated it roughly by the means of stating the one inch equals two point five centimetres. Though this is correct, the conversion from one type of measurement to another could have resulted in a loss of accuracy. People may also have added their hair into their height. If I were collecting the data myself, I would have been able to ensure that the data was all collected absolutely

Gcse Statistics: Coursework
GCSE STATISTICS: COURSEWORK 'WHAT AFFECTS A PERSON'S ABILITY TO ESTIMATE?' Aims, Design and Strategy This investigation is all about finding out what affect's a person's ability to estimate. To answer the question to its full extent, I need to investigate thoroughly and be precise. My aims for this investigation are: - To record what factors affect a person's ability to estimate and to what extent. - To investigate the chosen variables in depth, to ensure an accurate result is made. The strategy for completing this task will be to simplify down the investigation into different areas. From doing this I can investigate in more depth. I hope to achieve a conclusive set of results to show which variables affect a person's ability to estimate. My hypothesis of this investigation is that age and intelligence will be the two main variables to influence a person's ability to estimate. I think this because, - For instance, if I compared a man of 45 and a boy of 15 to estimate, I'd predict that the man would estimate closest. I think this because the man has possibly got more experience than the boy at estimating. - A person's ability to estimate can be varied by intelligence. For example, if I asked two boys in Year 10 to estimate, I would expect the boy with the better mathematical knowledge to estimate closest. I think this because he would be more able in maths, which would
Mayfield High School Maths Coursework
Mayfield High School Maths Coursework My Hypothesis My first hypothesis which I have chosen to test is:- THE HIGHER THE KS2 RESULTS OF STUDENTS, THE HIGHER THE IQ RESULTS ARE. I have chosen this particular hypothesis because many students who tend to have a high IQ, have a high KS2 result too. I have also chosen this hypothesis because, many students at my school who have a high IQ tend to do well in their KS2 exams and get a high grade and therefore I would like to find this out for my-self. The data which I will be using to find out if my hypothesis is right or wrong will be from Mayfield High School. All the data that I will need will be provided for me at school on the computers. This data will include a range of different information on students from years 7-11. Sampling For my hypothesis I will be choosing a sampling size. I have chosen my sample size to be 50, as it will be more accurate. Also using the sample size of 50 will give me a wider range of data and therefore help me with my hypothesis more. There are various samples, which can be used. However, I am going to use random sampling and stratify sampling and this way it will avoid bias results. The random sampling will pick out my data in any order. The below formula is used to stratify my samples. The formula that I will use to work out my samples is:- Number of students used in sample= Total

Find out whether my theory that year 10 pupils are better at estimating the length of a stick than year 7 pupils.
Maths Coursework Statistics Hypothesis- In my investigation I plan to find out whether my theory that year 10 pupils are better at estimating the length of a stick than year 7 pupils. Plan- In my investigation I plan to use secondary data gathered from both year 7 and year 10 pupils, which I will then do a random sample of which will be used to find the mean, median, mode, range as well as standard deviation which I will then put into groups and frequency tables to compare and from this I will hopefully be able to come to a conclusion. Aim- I am hoping to find if the statement that year 10 pupils are better at estimating length than year 7 pupils is true and find different ways of proving this. I am hoping to find a mean for the both groups to compare where I will hope to find that the year 10 mean is closer to the actual value (1.36m) than year 7 pupils and this I hope will help me come to a fair conclusion. I am also hoping to find the standard deviation for both groups and hope to find that year 10 pupils will have a smaller standard deviation than the year 7 pupils because I believe it is more reliable because it shows less range which means all of the pupils have answered fairly similarly because a wide range means people where miles away with their guessing. Sampling- I will number each piece of raw data and then I will use the random search on my calculator. I will
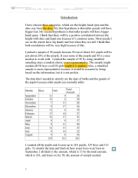
data handling
Introduction I have chosen three categories, which are the height, hand span and the shoe size from the data. My first hypothesis is that taller people will have bigger feet. My second hypothesis is that taller people will have bigger hand spans. I think that there will be a positive correlation between the height with shoe and hand size because it's common sense. Most people I see on the streets have big hands and feet when they are tall. I think that both correlations will be very high because of this. I picked a sample of 50 people because 50 out of about 261 pupils will be just about 20% of the people. It uses some of the people and 50 is a nice number to work with. I picked the sample of 50 by using stratified sampling since a random choice is not representative. The sample might contain all 50 boys or all 50 girls might it is random. Also, a stratified sample is more representative because it would be accurate by being based on the information, but it is not perfect. The data that I needed to stratify are the date of births and the gender of the pupils because older pupils are normally taller. Months Boys Girls Total Amount September 1 9 20 October 4 6 20 November 7 3 20 December 9 7 26 January 3 6 9 February 7 0 27 March 5 7 32 April 9 8 7 May 9 1 20 June 2 3 25 July 9 6 25 August 4 6 0 29 32 261 I counted
Statistics Coursework
STATISTICS COURSEWORK Tesheen Moosa Statistics Coursework Introduction I have been asked to examine the student's attendance figures from all year groups (7, 8, 9, 10 and 11) at Hamilton Community College. I will be investigating whether the age of the students affects their attendance figures at school and does it affect their learning and exam results as well? To start my research, I was given the attendance figures by the school for all of the year groups for the 2003 - 2004 academic years. I will then start to process data (attendance figures) firstly by reducing the amount of data that I will have to process using the method of stratified sampling. By using stratified sampling I will then only use a fair amount of data according to the percentage that I'm comfortable with. I will only be using 20% of the attendance figures from each year. A scientific calculator is used, to randomly select attendance figures that I am going to use, so that the new set of statistics isn't bias and isn't affected by my conscious decision. Using the new set of data, I will collate the data in frequency tables (to display all of the frequency distributions), in order to enable easy interpretation and analysis. Secondly, after collating the data, I will then display the new set of data in forms of graphs/diagrams and charts so that it will be easier for me to compare and study the
Reaction Times
Reaction Times Plan Hypotheses: 1) Boys are faster than girls are 2) Right-handed students are faster than left-handed students are 3) Right-handed boys are faster than right-handed girls are Possible methods of testing . Hit the mole (arcade game)- I would time how many moles they could hit in one minute, repeat this 3 times to get a fair result and then find an average. This would be read as the higher the number of moles that are hit, the faster the reaction. However you would have to travel to an arcade to carry this test out and it would be extremely expensive. 2. Stopwatch- I would tell the student to stop it at a certain time e.g. 2 minutes, and however many seconds before or after they stopped the stopwatch, would be their reaction time, the closer the number of seconds it is to 2 minutes, the faster the reaction. This would of course be repeated 3 times to get a fair result and then the average found. However the stopwatch buttons may get stuck, therefore altering results. 3. Dropping a ruler- I would take a 30cm ruler and make sure that the zero is inline with the index finger. I would then drop the ruler, which would be caught by the student (who is standing), then the number of cm's nearest to the index finger where the zero was lined up with, would be taken down as the reading for their reaction times. The results would be read as, the lower the number