See overleaf for collected data
On this page I have included results that I calculated with the help of Microsoft Excel. I can then later compare my own calculated results with those shown below.
To get a visual idea of the spread of my data, I decided to represent it in a stem and leaf diagram:
N = 52 156 6 represents 156 mins.
Stem and Leaf diagram showing the total duration of a sample of 52 films (unsorted)
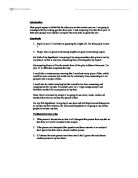
To help me when constructing a cumulative frequency diagram, I have sorted the above diagram:
N = 52 156 6 represents 156 mins.
Stem and Leaf diagram showing the total duration of a sample of 52 films
(sorted)
As you can se from the above diagram
· The shortest film has a duration of 77 mins, and the longest is 213 mins long
· Most films are in the group 120-130 mins.
I have now decided to construct a frequency table so that I can draw a cumulative frequency graph, which will enable me to draw a box and whisker plot, and therefore visually see any or all outliers in my data. Here follows my table:
See overleaf for cumulative frequency diagram.
From Graph:
First Quartile - 129 mins
Mean - 117 mins
Third Quartile - 103 mins
From my sorted stem and leaf diagram it is possible to calculate median, first and third quartiles of my data, and so will now do so, so that I can compare these results to those obtained from my graph.
First Quartile = ¼ x 52 + ½ = position 13.5
Value = 103 mins
Median = ½ x 52 + ½ = position 26.5
Value = 117 mins
Third Quartile = ¾ x 52 + ½ = position 39.5
Value = 129 mins
As you can see, my graph values deviate from the calculated values. Therefore as the calculations will probably be more accurate than the graph results, when I draw my box and whisker plot, I will use the calculated values.
See below for box and whisker plot:
I am now going to calculate the mean and standard deviation of my data so that I can see where the outliers of my data, if any, are.
Mean
Standard Deviation
In most data sets
· About 2/3 of the values lie within 1 standard deviation of the mean
· About 95% of the values lie within 2 standard deviations of the mean
· About 99.5% lies within 3 standard deviations.
To see if this is so with my data, I will now perform the relevant calculations:
Mean = 120.13
120.13 + 27.91 = 148.04
120.13 - 27.91 = 92.22
Therefore about 2/3 of my data should lie between 92 mins and 148 mins. That is, about 34 values should be within this range. About 38 values are in this range, so this piece of information is relevant for my information.
Mean = 120.13
120.13 + 2(27.91) = 175.95
120.13 - 2(27.91) = 64.31
Therefore about 95% of my data should lie in the range of 64 mins to 178 mins. About 49 values should be in this range. About 49 values are in this range, and so I have identified that the outliers in my data are 181, 186 and 213 mins.
SUMMARY OF WHAT I FOUND AND ACCURACY
I began this investigation with the aim of finding out the average time of a song and determining how long or short a song can be without the audience being bored or not pleased, respectively.
I found that the average duration of the sample of songs that I used was about 235seconds. The shortest film in my sample was 125.4 seconds long, and the longest was 325.2 seconds. About 2/3 of the sample of films fell between 182.seconds and 284. seconds . Therefore my media studies coursework should aim to be between about 182 seconds long and about 284seconds long. I will aim to make the song to be about 233secondslong in total length, as this is the average between these two values. I think that this investigation has been a success because I have achieved what I set out to achieve: what length my song should be for maximum audience enjoyment.
In terms of accuracy, I think that this investigation has been a success. I have constructed a table to show my graph values, where applicable, my previously calculated values and the computer's values:
As you can see, the only real discrepancy occurs with the computer's standard deviation, and I can only conclude that this is because it has used a mean with more decimal places, and therefore it is more accurate. It also occurred because the calculated standard deviation was found from grouped data and therefore only an estimate. Graph discrepancies occur because of inaccurate drawing techniques. Other than that, my values are, on the whole, pretty accurate.
The quality of the investigation could be improved by using a more varied population, in an ideal world this would be an Internet site of every film ever made. As this does not exist, the site that contains the most comprehensive list of films will have to do. Which in this case is the site that I used, the HMV superstore site. My method of collection would not vary even if I used another site. If I used three randomly picked numbers for each category, then I would end up with a sample of 78 films, which I think is too produce an accurate report on.
I think that this investigation was a success, as it helped me to gain some information that will help me in another topic, and because it was completed as accurately as I could.