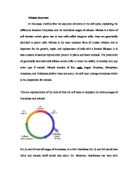
The third phase – cell division – is when the cell itself divides into two by cytokineisis to form the two daughter cells. The length of the cell cycle can differ greatly due to factors such as environmental conditions, or the type of cell. Nuclear division is where mitosis occurs – it is known as the mitotic cell cycle.
The first phase of mitosis can be split into two stages – early prophase and late prophase. The two centrioles replicate just before the start of prophase. The chromosomes become more visible as they stain intensely. They coil up, becoming shorter and thicker. Nearer the end of prophase the centrioles begin to move to opposite poles of the nucleus. The nuclear envelope seems to have disappeared – it is no longer visible with a light microscope as it has been broken down into small vesicles. The nucleus also ‘disappears’ forming a part of several chromosomes. Each chromosome consists of two sister chromatids joined together by the centromere. Microtubules develop from the centrioles forming a mitotic spindle between the two centrioles. Increasing the length of the spindle, by growing more microtubules they push against each other to the opposite poles of the nucleus.
DNA has been replicated by the time metaphase is taking place. Microtubules from the two poles are attached to the centromeres of the chromosomes. The chromosomes are then pulled along the spindle and line up across the centre of the cell.
In anaphase, all the chromosomes split at the centromere and are pulled by the microtubules to the opposite poles of the nucleus. Mitochondria provide energy for this process, they gather around the spindle fibres.
In the final phase – telophase – the chromatids reach the poles and uncoil, becoming long and thin once again, and forming chromatin. Each one of these chromatids contains a DNA molecule which will replicate itself during interphase before the next division, as will the centriole.
The nucleolus and the nuclear envelope start to re-form, whereas the remains of the spindle break down. Cytokineisis takes place; the cell divides into two by constriction from the edge of the cell.
- ‘Biology 1’ – Mary Jones, Richard Fosbery & Dennis Taylor, pgs 83-85
- ‘Essential AS Biology for OCR’ – Glenn and Susan Toole, pgs 90-93
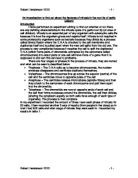
The figure below shows some of the stages of mitosis found in whitefish blastula.
Image from:
Risk Assessment
Null Hypothesis
With there being four stages in the mitotic cell cycle, I would expect there to be 25% of cells in each stage, meaning a ratio of 1:1:1:1, so that there is an equal number of all four stages. However, the results obtained - shown in the table below - show something different.
Results
The results above consist of my own, from my own experiment, and from 9 other studies. The findings show that most common phase of mitosis found in the cells was prophase. Metaphase was the second most popular stage, followed by anaphase, leaving telophase with only 19% of cells currently in that stage.
The charts above show the results of the 10 studies used, including my own. From the first chart it can be seen that prophase was the most popular phase, however, by looking at the second chart, it can be seen that this was not the case in all 10 studies. For example, in study 9, prophase actually had the least number of cells, and Metaphase was viewed the most. Excluding study 9 though, prophase was indeed viewed the most. This could be because individuals found prophase easier to spot and identify. Prophase is often viewed as two separate stages, early prophase and late prophase; this could also affect why students viewed this phase the most.
The results from my cell counting and the other studies both show that prophase was the most popular. Even metaphase and anaphase are similar in my individual findings and the class’s results. However, with telophase there is quite a difference between my results and the rest of the studies. However, both pie charts show similar findings, so the class’s results and my own should be quite reliable.
Chi-Square (X²) Test X² = ∑ (O-E) ²
E
O = Observed Data
E = Expected Data
To determine whether or not the results of an experiment have happened by chance, statistical analysis is used. One method of this is the Chi-square test, which can be used when the data collected is expected to occur in an exact ratio. In this case the expected result would be 1:1:1:1 for all the stages of mitosis.
To find the probability I will use the ‘degree of freedom’ (df). When n=the number of classes of data.
Df = n -1
Therefore the degree of freedom in this case will be… 4-1 = 3
For the ten studies, X² came to 32.112. For my null hypothesis to be correct, X² would have to be smaller than the probability of 0.05. However, the results I obtained show a much higher X² than there is shown in the table. Therefore my null hypothesis will have to be rejected, so it is incorrect. This means that there aren’t an equal number of cells going through each phase of mitosis. This would imply that the time length of each stage of mitosis is different
Evaluation