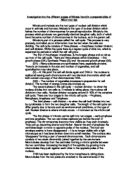
Results
This is a table of my results let P stand for Prophase, M for metaphase, A for anaphase and T for Telophase and the numbers to represent the number of cells suspected to be undergoing that stage of mitosis. Each person in the class has a set of results, which I have given a sample number.
= My results = Error number of cells counted only 48
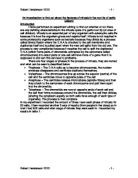
Table of averages for the whole class result
I have took out sample 1 from my table of results when calculating these averages as there is a clear error although only slight and probably insignificant I am going to discard it from any further analysis of the results to try and improve the accuracy of my results.
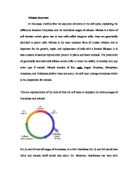
Below pie charts representing both my own and the class average results of how many cells under going each stage of mitosis.
Pie chart representing class data for the average number of cells found in mitosis:
Pie chart representing my own results of how many cells found in each stage of mitosis.
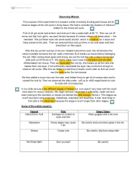
Scatter Graph to show the correlation between the group’s answers for each stage in mitosis including trend lines.
Chi – squared test
I am using this as a statistical analysis to assess the significance of the differences between observed and expected results of how many cells would be in each stage of mitosis.
I have 3 degrees of freedom and the formula for the test is:
Evaluation and conclusion
Analysis of my results concludes that each stage of mitosis does not necessarily take the same length of time. Looking at my analysis of results prophase appears to take the longest space of time as the chi square test shows this is due to factors other than chance for example misidentification however there is no evidence or research I have came across that states the relative length of each stage is equal(or not). Logically prophase is the stage where the cell appears to be undergoing lots of preparation and a lot of processes that are noted which appear to be far more than those for other stages, therefore it could be that the prophase stage is longer because more things happen within the cell in the stage which has been classed as prophase in mitosis. In this information taken from the source shown late prophase is named as an almost separate stage prometaphase, it shows how much activity goes on in the cell in the stage of mitosis named prophase
1. Prophase
-
The two of the cell, each with its pair of centrioles, move to opposite "poles" of the cell.
-
The mitotic spindle forms. This is an array of , synthesized from tubulin monomers in the cytoplasm, that develops from each centrosome.
- The chromosomes become shorter and more compact.
. Prometaphase
-
The disintegrates.
-
A protein structure, the kinetochore, appears at the of each chromatid.
- With the breakdown of the nuclear envelope, spindle fibers attach to the kinetochores as well as to the arms of the chromosomes.
The microtubules attached to a kinetochore exert tension on its chromatid. For each dyad, one of the kinetochores is attached to one pole, the second (or sister) chromatid to the opposite pole. Failure of a kinetochore to become attached to a spindle fibers interrupts the process.
3. Metaphase
The tension is proportional to length; thus if a dyad approaches one pole, the tension in the opposite direction increases and the dyad is pulled back to an equilibrium position midway between the poles. In due course, all the dyads reach this position, the equatorial plane or metaphase plate. The chromosomes are at their most compact at this time.
4. Anaphase
The sister kinetochores suddenly separate and each move to its respective pole dragging its attached chromatid (chromosome) behind it.
5. Telophase
A nuclear envelope reforms around each cluster of chromosomes and these return to their more extended form.
Cytokinesis
Mitosis is the process of separating the duplicates of each of the cell's chromosomes. It is usually followed by division of the cell. However, there are cases ( is an example) where the chromosomes undergo the mitotic process without division of the cell. Thus a special term, cytokinesis, for the separation of a cell into two.
In animal cells, a belt of forms around the perimeter of the cell, midway between the poles. As the belt tightens, the cell is pinched into two daughter cells.
In plant cells, a membrane-bounded cell plate forms where the metaphase plate had been. The cell plate, which is synthesized by the Golgi apparatus, supplies the plasma membrane that will separate the two daughter cells. Synthesis of a new cell wall between the daughter cells also occurs at the cell plate.
-
In all the research and information I have looked at the phrase below was the only indication as to how long the stage of anaphase is with no comparison with other stages of mitosis and very vague regarding mitosis in the root tip of an onion cell. It may only be quick in onion cells however anaphase may take quicker or longer in different types of cells. Another explanation therefore is like anaphase the other stages are quite rapid and take roughly the same time as the pie charts and graph show there is only a small difference between them compared to that of prophase. Therefore prophase takes slightly longer because the cell draws the process out for longer the activities in this stage take longer or because more activity is going on. My results suggest anaphase is the shortest phase, this is also what I would interpret from the phrase I have pulled out because there is no indication of time about any of the other stages and a point is made of indicating the ‘rapid process’ that only takes a few minutes. However the class average shows that both anaphase and telephone take the same length of time so this may not be necessarily true and it has definitely not been proven in this experiment. Even if anaphase is shorter or prophase longer or both, my results contradicted my prediction, that each stage would be equal.
‘Anaphase typically is a rapid process that lasts only a few minutes.’
-
micro.magnet.fsu.edu/micro/gallery/mitosis/mitosis.html
Here from left to right the photographs show firstly a resting cell
A normal resting cell exists in a state called interphase in which
the chromatin is undifferentiated in the heavily stained nucleus.
Interphase is another part of the cell cycle, which takes up most of the time a small part of the cycle is for DNA replication and another section of it for nuclear division by mitosis and cell division cytokinesis.
Before the cell enters the mitosis phase, it first undergoes a
synthesis or S phase where each chromosome is duplicated and consists of two sister chromatids joined together by a specific DNA sequence known as a centromere. Centromeres are crucial to segregation of the daughter chromatids during mitosis. The first phase of mitosis is known as the prophase, where the nuclear chromatin starts to become organized and condenses into thick strands that eventually become chromosomes. During prophase, the cytoskeleton (composed of cytoplasmic microtubules) begins to disassemble and the main component of the mitotic apparatus, the mitotic spindle begins to form outside the nucleus at opposite ends of the cell.
Then the picture on the right is the cell in early prophase as it is obvious to see it is hard to spot very many differences between the pictures and therefore looking through a microscope at these cells it would be difficult to identify which one was actually in prophase. The cells are much easier to be identified in later prophase. Therefore misidentification may in fact be able to account for the larger number of cells thought to be in prophase that may in fact be in interphase mistaken for early prophase. There is also the fact to consider that each stage of mitosis is manmade and it is difficult to determine when each stage starts and ends.
However looking at the drawn up charts the overall results do show some correlation. Looking at the pie charts my own and that of the classes results are visually rather similar because my results are not far off matching the class averages. This may suggest my results may be fairly accurate. The graphs show a quite strong positive correlation with the class results with only one anomaly I have pointed out with a red arrow. This may be due to misidentification or recording error or any of the explanations already stated. As I have said there is a correlation which may also suggest the results could be reliable and quite accurate. There is a difference between each individual result because each commercial slide that was looked at was individual with different individual cells therefore no slide will be identical.
Misidentification may have been helped with a better resolution microscope as the light microscope has limitations although it should be adequate to study the stages of mitosis. Perhaps an electron microscope would have reduced the likeliness of misidentification making the results more reliable and accurate. This would be because the electron microscope would allow a higher resolution and magnification compared to the light microscope, which allows less detail to be observed.
I presume my results are fairly accurate as I have already mentioned there is a correlation. However it is difficult to comment on how accurate or reliable the results are for those other than my own. My own results were found the most accurate way I thought possible. I made sure the same cells were not counted by using the microscope needle and a piece of paper to examine the next section of the slide I had not yet looked at by putting paper over the slide I had not yet looked at and counting abut 5 rows of cells, as the cells were arranged in fairly accurate rows. I am fairly sure I did not count the same cells more than once and my method was fairly accurate. However I do not know how others conducted their investigations and how they ensured reliability of their results. This puts a question mark over reliability of the overall results and also effects accuracy.
The results should be fairly reliable as I have analysed results from 16 samples. The individual results do have a wide range varying from 3 up to 14 in the anaphase stage. This however as already stated could be due to individual differences (each slide contains different individual cells which gives rise to variation).
Reliability could be improved by repeated investigation of the same slide then the error due misidentification or other errors can be judged and taken into consideration. Also each person doing the investigation should take the same steps to improve reliability e.g. How to ensure cells are not counted more than once. Perhaps when each cell is observed there should be a second check person if more than one person agrees that the cell is that particular stage of mitosis it is more likely to be correct.
There is argument to suggest that my conclusion, that each stage of mitosis is not equal is fairly safe. However, there is also a lot of evidence to suggest that it is not very reliable i.e. I can only account for the reliability of my own results. To say my conclusion was completely safe I would have to do further investigational work taking the steps suggested to improve reliability.