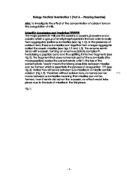
Thus the following prediction is made for the graph:
Preliminary Results
Using the method previously described (with equal number of volumes for a single test) the following results were obtained. (Tests were done twice for a given concentration to ensure that they were repeatable.)
The preliminary confirmed the following:
-
The control of 0.0M concentration of the calcium chloride solution confirmed that with the absence of calcium ions, coagulation does not occur on a visible timescale.
- The points between 0.5M and 1.0M will determine whether the trend is a straight line or a curve, hence my range of points was chosen (0.4M to 1.0M).
- The repeatability of the test was ensured by the fact that the time differences for a certain concentration were very small (the maximum being 4 seconds).
- Having seven different values will be sufficient to provide valid inferences and reliable results and is achievable in a reasonable timescale.
Method
One can very simply test this effect by means of a simple experiment as follows:
-
In seven 50cm3 beakers mix:
-
20cm3 milk
-
2cm3 sodium citrate solution
- Wait for 5 minutes for calcium ions to be removed by the sodium citrate. Removal of calcium ions by sodium citrate allows one to add a known concentration of calcium ions.
To make the assumption and experiment as accurate as possible, one has to accurately measure out the volumes of milk and sodium citrate solution using separate 10cm3 and 5cm3 syringes respectively (to prevent cross-contamination between beakers).
- Add to each beaker:
By this method, a fixed final volume is maintained. Separate 5cm3 syringes are used for calcium chloride solution and water to prevent contamination. Mix each solution thoroughly with a glass rod, remembering to wash the rod with distilled water before use with each beaker so as to prevent cross-contamination.
-
Using a fresh 10cm3 syringe, add 10cm3 of solution 1 to a clean 50cm3 beaker. Using a 1cm3 syringe, add 1cm3 of the rennin solution, starting a stopwatch. Stir with a fresh microscope slide for roughly five seconds and take it out. A thin layer of milk should be now on the surface. Stop the stopwatch as soon as signs of coagulation first appear i.e. for ‘flecks’ of curd to appear on the slide. Record the time taken. The appearance of the coagulum is distinguishable by its whiter appearance to the liquid milk. Wash out the beaker tested in with distilled water, and repeat this step with the remaining 20cm3 of milk solution in beaker 1 a further two times. One will therefore get three separate readings for different calcium ion concentrations ensuring a certain degree of reliability.
-
Repeat step 4 for beakers 2-6, remembering to wash the 10cm3 syringe and the beaker tested in with distilled water each time (to prevent cross-contamination).
The prevention of cross-contamination leads to better precision and better accuracy in the results.
Apparatus
Materials Required:
Apparatus Required:
(Syringes allow for not only very precise measurements but are also time-efficient)
Variables
Independent Variable: Concentration of calcium chloride (i.e. calcium ions)
Dependent Variable: Rate of coagulation of milk
Controlled Variables:
- Volume and concentration of all solutions except the calcium chloride solution
-
Volume of calcium chloride solution and water (in total 1cm3 per test)
- Temperature must be kept constant at room temperature because it influences the rate of an enzyme’s activity. Milk has a relatively high specific heat capacity, meaning that slight changes in the air temperature will make almost no difference to the results. Nevertheless I will monitor this with a thermometer.
- pH – although the materials have different values for pH, the end values for pH of the milk solutions were tested (in a preliminary test with universal indicator paper) to be too significantly similar for pH to have an effect on the activity of rennin. The end pH was roughly 6 for all the milk solutions.
Safety measures:
General care to be taken with the apparatus; if glass is broken then immediate disposal required to prevent broken shards which can cause cuts.
Calculations:
The time taken for the test will be recorded in a table as following:
A mean time of the three readings will be taken for further reliability. The rate of reaction is usually taken to be the initial rate of reaction, and is usually measured by taking the product produced per unit time. Unfortunately, there is no way in this experiment that one can measure accurately how much coagulation has occurred. As a result, the only distinguishably common moment, between tests of different concentrations of calcium ions, is the starting point of coagulation i.e. when ‘flecks’ of curd first begin to appear. The reciprocal of the time taken will then be proportional to the true rate; however this also means that the actual values and units are arbitrary.
i.e. Rate of Coagulation=
A graph would then be plotted of the rate against concentration of calcium chloride solution added, labelled as below, from which inferences could be made.
Total Word Count: 1024
Bibliography:
Figure 1: Pg 82, Food and the Chemistry of its Contents, T.P. Coultate
Figure 2: Pg 84, Food and the Chemistry of its Contents, T.P. Coultate
Figure 3:
General Sources of Information:
[1]Food and the Chemistry of its Contents, T.P. Coultate
[2]Enzymes in Industry and Medicine, G.F. Bickerstaff
[3]Biology 1, Jones, Fosbery, Taylor
[4]
[5]