For other health and safety issues before beginning the experiment a log must be kept of you and the person assisting you along with the time you go and the time that you will be expected back. This will help to keep track of where you are and when. As a result, it will be easier to know whether you’re lost or in trouble so help can be given.
When using a digging blade avoide any contact with the blade. Another point is to be careful that when digging not to dig the blade onto your foot or hands and harm yourself.
First Aid kits must be taken and kept with you at all times just incase there is an accident.
After carrying out the experiment it is very important that hands are washed properly with soap to ensure all the bacteria and soap has been removed. If these were to enter the body these could prove harmful.
Introduction:
The nature of the study is to see whether there is a significant relationship between the height of a bracken and light intensity. The investigation will be carried out in Epping Forest. It is located 2 miles (3km) from the M25 (Junction 26), 4 miles (6.5km) from M11 (Junction 5), 2 miles (3km) from Central Line tube at Loughton station. The forest covers 6300 acres on land (2500 hectares). It measures 11 miles long and 4 miles wide at its longest and widest points. The types of ecosystems present in the forest are grassland, woodland, heath land, bare soil and fresh water.
In the past (before 1800ad), everyone was allowed to use the land. Then it was used for grazing, provide raw materials such as wood or fuelling and building and even to provide food for humans as well as other animals. Coppicing then came into use. Later on (late 1800), Henry the 8th wanted it for hunting. The deer’s ate all the new shoots so pollarding came into effect. In 1878 Epping Forest became a recreation and conservation site when the city of London took over charge of it.
Epping Forest is now a ‘Site of Special Scientific Interest’ (SSSI). This means that it is well managed and kept.
There are many factors which affect the habitat. These can be summarised into Abiotic and Biotic factors.
Abiotic factors are those which are non-living and have never been alive. Examples of these are:
Temperature, ph of the soil and moisture, and the climate (wind, amount of water etc).
Biotic factors are those which are affected by the abiotic factors, and are living. Examples of these are: lengths and height of plants or trees.
Abiotic factors affect the biotic factors as the biotic factors are dependent on the abiotic factors. As the biotic factors are dependent, any change in the abiotic factors would cause a change in the biotic factors. An example could be when photosynthesis occurs better in areas with more light rather than areas with less light. This is mainly due to the rate of photosynthesis depending on the light intensity.
Temperature of the air affects the growth of bracken, as the rate at which photosynthesis occurs varies with temperature. For example, at a higher temperature, (in warmer conditions), the enzymes and substrates involved in photosynthetic reactions have more energy to collide and cause more successful collisions. As a result, the rate of photosynthesis increases. At lower temperatures, (in cooler conditions), the enzymes and substrates have less energy to collide, and so there is less chance of a successful collision occurring. This would affect the height of bracken as the more photosynthesis occurs, the more food produced for the plant, which would result in taller bracken plants. To summarise:
- Photosynthesis increases with temperature to a point. This point is usually the point at which the enzymes become denatured and so reduces the rate of photosynthesis.
- Respiration rapidly increases with temperature. This is because the gases can diffuse more easily through the stomata and give the mitochondria a greater supply of gases for respiration to occur.
- Transpiration increases with temperature. This is because the stomata are usually open more and allows more water to evaporate through the leaves.
- Flowering may be partially triggered by temperature. This is shown as most plants flower during spring and summer, mainly due to the fact that there is a higher chance of insect pollination occurring.
- Low temperatures reduce energy use and increase sugar storage. This is due to less energy being used in chemical reactions like respiration and photosynthesis, which allow the sugars produced in photosynthesis to be stored more.
The pH of the soil also affects the height of bracken as most plants usually prefer slightly acidic soil and bracken is one of them. Studies have shown that “Bracken litter reduced soil pH to 4 - 4.5”.This suggests that the preferred pH of soil to the bracken plant is between 4 and 4.5. Due to this, if the pH of soil is too acidic (lower than pH 4) or too neutral or alkali (higher than pH 4.5), then the bracken wont be able to grow to its greatest height. This would be because the conditions would not be ideal for photosynthesis and other processes (such as active transport and simple diffusion) to occur. As a result, photosynthesis would occur less and at a slower rate, producing less food for the plant and preventing it from growing to its full potential.
The pH of soil has a major effect on the plant because the same pH is in the water which is being taken up by the roots of the plant. If the soil is too acidic or too alkali, then this could have a dramatic effect on the plant and may cause it to die. However, plants such as bracken can overcome this by maintaining their ideal conditions. Bracken plants do this by having leave litter of a certain pH, which will control the pH of the soil.
Plants need water for cell metabolism, cell expansion, turgor support of their nonwoody cells and for transpiration. Too little water would cause plant growth to be stunted or plants will die. For example, if there is insufficient water in the soil, stomata will close and a plant will be unable to
photosynthesise because it cannot get carbon dioxide gas. This is why water is vital for plants to survive. The moisture of the soil has an impact on the growth of bracken because too little water may cause the plant to dehydrate, whereas too much water may cause the plant to become waterlogged and drown. This is why the soil moisture is an important factor in determining the cause of the height of bracken.
Method:
Before you carry out your experiment, co-ordinates need to be calculated the hiesght of the bracken will be measured. This will be done using the random number table taking numbers between 0 and 15. These numbers will be the coordinates at which the height of bracken will be measured. 12 pairs of coordinates will be needed as 12 samples will be taken from each plot (light and dark). The same coordinates will be used for both light and dark areas.
Part 1:
Collect the apparatus
Find an area that is relatively dark with bracken, and another area with bracken that is relatively light. To determine whether an area is light or dark measure its light intensity before you start. If the light intensity is below 800 units, then this would be considered a dark area. However, if it was above this, then it would be considered a light area. These areas should be easily accessible and not dangerous as to have lots of thorns or anything which may cause harm to you during the experimental process.
Select which an area to carry the experiment out on first (I did the dark area first). Then place a tape measures at right angles to each other so they make an x axis and y axis. This will determine the plot of land and will help to find the spot where the coordinates are, so height of bracken can be measured.
Next read off the coordinates of each point and hold the quadrat at arms length over the point. You would need someone to help you read off the coordinates and to hold the quadrat for you.
Whilst the quadrat is held over the point, measure the height of 4 of the tallest bracken leaves. This should be done using the metre rule. Read off the measurement very carefully and to be precise record to 0.5cm. In some cases the bracken leaves will be taller than 100cm (1 meter), then both metre rules should be used to measure the height of the bracken leaves. You should continue this method and measure the height of bracken for all the coordinates.
Once the bracken has been measured in all 12 coordinates,the temperatures of the soil and air need to be taken. This should be done at the following co-odinates: (0, 0), (0, 15), (15, 0), (7.5, 7.5) and (15, 15). These are co-ordinates of each of the corners and the centre. This would give you the most varied data, as you are taking samples from the coordinates which are as far away from each other as possible. If the soil samples turn out to be similar, it can be assumed that the soil moisture is roughly the same throughout the plot of land. The thermometer should be inserted (to a depth of 3cm) into the soil in the bottom left hand corner of the quadrat at each of the points listed above. This is to ensure a fair test. The air temperature should be measured by holding the thermometer at shoulder height. The thermometer should be held from the top (as holding it from the bottom could heat it and give inaccurate results). The soil thermometer and air temperature thermometer should both be given 2 minutes to allow them to measure the temperature. Then record the temperature at each of the 5 coordinates. Temperature should be measured to an accuracy of 0.5 degrees (˚C).
This also needs to be done at each of these points is to obtain the soil sample. Theremometre should be inserted to depth of 10cm at all the coordinates in order to make it fair as well more accurate and reliable. To do this you need to take the soil auger and dig it into the ground and twist. This may take some effort and should be done to the depth of the digging blade. Take care when using the blade and measure that when digging not to dig it into your foot and hurt yourself. The augur should be dug in the bottom left hand corner of the quadrat, the same one where the temperature was taken from, in order to keep the experiment fair. Once the soil comes out collect small quantisties of soil each time and place it in a small bags. The hole the augur just made should be filled with the soil around it. This is to cause minimal damage to the habitat. Remember that this needs to be done at each of the 5 points listed above.
Next you need to take the light meter and measure the light intensity at the same 5 points listed above. To do this you must hold the light meter at shoulder height and at arms length. Then allow 5 seconds for the meter to take the reading, and note it down. You should do this for each of the coordinates ensuring that you are precise with the time taken to take the reading. This will give you more accurate and reliable results.
Then you need to quickly take the tape measures and place them on the light area. Once you’ve done that you need to take the light intensity at the same 5 coordinates. You need to do this as close as possible to the time as when you measured the light intensity of the dark area, in order to get a fairer and more reliable result, as the conditions may suddenly change whilst the experiment is being carried out.
Once you’ve taken the light intensity of the dark area at each of the 5 points, you need to repeat the method shown above for the light area.
To summarise, each plot of land (light and dark area), should give you 12 mean heights of bracken, and with each coordinate giving a maximum of 4 readings where possible (by this I mean if there are 4 branches or leaves of bracken then you should measure all 4, but if only 1, 2 or 3 are present you can only measure them and take the mean height from them). Also each plot should give you 5 values for light intensity at the same coordinates, as well as 5 temperature readings for soil and 5 for air, along with 5 soil samples in separate bags.
It is very important to carry out all of the measurements in exactly the same way, as any discrepancies could cause the results to not correlate. Ensuring that all of the measurements have been carried out in the same way with the same amount of care, the results should be very accurate and reliable.
Part 2:
This method is to be carried out in the laboratory.
Firstly, you need to take the 5 Petri dishes for the light area, weigh each of them and record their weight and label them.
Next you need to empty the 5 soil samples from the light area into separate Petri dishes. Once you’ve done that you should re-weigh the soil samples separately in the Petri dishes and record their weight.
Then you need to place them in a microwave for 15 minutes.
When that’s done, take them out, re-weigh the samples and record the results with the corresponding coordinates.
Then you should weigh the 5 Petri dishes needed for the ‘dark area’, and record their weight.
Next you need to take the 5 soil samples from the ‘dark area’ and place them in the labelled Petri dishes.
Now you must weigh the soil samples separately and record their weight.
Then put the Petri dishes in the microwave for 15 minutes.
When that’s done, take them out, re-weigh the samples and record the results with the corresponding coordinates.
Note: when placing these in the microwave, you need to place a small beaker of water towards the back of the microwave, so that the microwave doesn’t blow up. This could happen due to the microwave over-heating. You also need to make sure that there is nothing else in the microwave except the samples and the beaker of water. If there is something else, that could cause a spark, which can be very dangerous and also be fatal. Your results of your moisture test would also become void and ruin your whole experiment.
The soil left behind should be returned to the forest.
Once this experiment is done, you should have the weight of the soil before it was put into the microwave and the weight after it came out of the microwave. With these you can then work out the percentage moisture of the soils sample at that particular coordinate in that area. I have shown you how to calculate this in the analysing section.
Important points:
At first I was only going to take the 3 tallest leaves or branches of bracken, but to improve the accuracy and reliability of my results, I changed this to 4. As having the mean of 4 tallest leaves would be more accurate and reliable than having the mean of 3 heights.
As there is someone else helping to read off the coordinates and hold the quadrat over the coordinate in which the height of bracken is being measured, the person carrying out the experiment is not alone. This means that if something was to happen like a fall or someone getting injured, there would always be someone with the injured person and able to get help. This is important as you cannot go into the forest alone, just in case something happens. Also, having someone else with you would ensure that the results of your experiment were more accurate as you would have to do everything yourself, and you would be able to concentrate more on the exact measurement, without fiddling with too many instruments, as well writing the results on paper.
Controlling the variables:
All external variables that are not being measured will be controlled to stop them affecting the results of the experiment.
I will control the moisture of the two areas by carefully choosing areas which lie on flat land and not on a slope. If the site was to lie on a slope, then the moisture of the soil would vary considerably, as the soil towards the bottom of the slope would have higher percentage moisture than the soil at the top. This would be due to the water travelling down the slope. This will help me to come to the conclusion that light intensity is probably the dependent factor when the height of bracken is being measured. The greater the soil moisture, the more water there is available to the bracken. As a result, the plant can photosynthesise more and produce more food. Due to this, the height of bracken would increase.
Also, I will choose areas which do not vary in pH. I will do this by asking the Epping Forest fieldsmen whether the pH of the soil varies in the area I have chosen or not. If the pH did change in that area then, this might be one of the reasons why the height of bracken varies between the light and dark areas. As a result, I will not choose that area as one of the sites to carry out my experiment. Some pHs would be favourable, as photosynthesis might occur at a faster rate in a higher or lower pH. Therefore, the area with the pH more favourable to photosynthesis would have the taller bracken, as the bracken there would photosynthesise faster and produce more food.
Analysis
In this section I will be interpreting and analysing the results I obtained during the investigation.
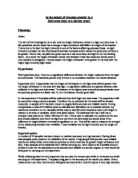
Here is a table showing the heights of bracken in the light and dark areas. There are the heights of each of the 4 measurements taken in each coordinate, along with the average height in each sample and area.
Fig1: Table to show the height of bracken in Dark and Light areas
As you can see from the table (fig1), the average height of bracken for the dark area was 29.04cm, whereas the average height of bracken for the light area was 98.04cm. This suggests that as the light intensity increases the height of bracken also increases.
From looking at fig 1 and graph 1 and 2, you can see that the shortest and tallest average height of bracken in the dark area (excluding 0) were 3.75cm and 95.75cm, respectively. Whereas in the light area, the shortest and tallest average height of bracken were 57cm and 145cm, respectively. Table 1 shows that the light area consistently had bracken in every coordinate within the plot, as the lowest measurement of height is 31cm. This also shows that in some points in the dark area, there was very little bracken. To prove this, if you look at the height of bracken in the dark area (in fig 1), you can see that there are many measurements with only 1 or 2 leaves of bracken, or even none. Sample number 4 shows that at (14.3, 3.1) in the dark area, there were no bracken leaves and so the height is 0. These are mainly due to the fact that the darker area had a high amount of canopy cover from taller trees which blocked out most of the sunlight. This would make it hard for the bracken to grow, and as a result, give shorter average height of bracken.
Also, the average height of bracken for the dark area was only 29.04cm, whereas the average height of bracken in the light area was 98.04cm. If you look at graph 1, you will be able to see that there area many points below 60cm and only 3 above 60cm. However, in graph 2, you will be able to see that there are only 3 points below 60cm and 9 above 90cm. This shows that there is a considerable difference between the height of bracken in the light and dark areas.
As you can see from the 2 graphs, I have drawn error bars to represent the maximum and minimum values for the heights of bracken in each area. By looking at the error bars in the dark area, you will notice that there are some samples with high maximum and minimum values. This suggests that the bracken was either quite tall, short or not present. Whereas if you were to look at graph 2, you will be able to see that the error bars are focused more around the average and have very few values that so not correspond with the average. Also, the averages in graph 2 lie almost always in the centre of the error bars in each sample. However, this is not the case in the dark area because here, there are 6 samples where the averages do not lie in the centre of the error bars. These are sample numbers 1, 3, 5, 6, 7 and 9, whereas in the light area, there are only 4, at sample numbers 2, 3, 4 and 8.
From table 1, you can see that there are only a few anomalies. The first one being sample 4 (at 14.3, 3.1) in the dark area, as in this coordinate, there was no bracken and so no readings or measurements could be taken. The second anomaly was the height of bracken in sample 2 (at 8.2, 12.3), which gave an average of 95.75cm. This was very high when compared to the other average heights in the dark area. From what I can see, there were no anomalies in the light area, as the height remained fairly constant but with a few averages being quite high and a few being quite low, but this was acceptable as they weren’t extreme, and occurred on various occasions. This was expected as the height of bracken is not likely to be the same within a plot of land due to competition. There would be a rivalry between bracken plants as each is competing to gain as much sunlight as possible, in order to photosynthesise more. Other types of competition would have been from different species of plant. The other species present were thorn bushes and small weeds. These were mainly underneath the bracken leaves and so didn’t compete much towards light and so the intensity or amount of light falling on the bracken leaves was not a factor. However, the other species did compete for water, nutrients in the soil and overall ground space for roots and stems.
Variables:
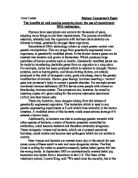
The table below shows the light intensities and temperatures of the corners and centre for the dark and light areas.
Fig2:
As you can see from the table above (fig2), the temperature of the light area was slightly higher than that of the dark area. This is shown in the temperature of soil in the light area being 15.9˚C; 0.7˚C higher than the 15.2˚C measured in the dark area. Also, the temperature of the air in the light area was 18˚C; 0.1˚C higher than the 17.9˚C measured in the dark area. You can also see from the table that the average light intensity in the dark area was only 0460 (Lux), whereas it was 1082 (Lux) in the light area.
Both tables (fig1 and 2), suggest that as the light intensity increases the height of bracken also increases. This proves by hypothesis to be correct. As the height of bracken clearly depends on the amount of light available to the plant.
The soil and air temperatures remain fairly constant. As a result, these have a minimal effect on the height of bracken between the light and dark areas. The difference in temperature is mainly due to the light area having more sunlight than the dark area. This would be expected as the whole focus of the investigation is to see the difference between a light and dark area.
However, there is a massive difference in the light intensity, which I wasn’t expecting to be so great. The average light intensity of the dark area was 0460, whereas the average light intensity for the light area was 1082. …..
Mann-Whitney U test
The Mann-Whitney U test is used to compare the medians of two sets of data. It measures the overlap between the two data sets. Also, no assumptions are made about fitting a normal distribution.
This test will prove whether this difference in height is likely to be due to chance or the variation of light.
By taking the height of bracken, we can carry out the Mann-Whitney U test. This can be done by first placing the average heights of bracken (in both light and dark areas) into data sets as shown below:
Fig3:
The equation for working out the Mann-Whitney U test for data set 1 is:
U1 = n1 x n2 + ½ n2 (n2 +1) – ∑R2
The equation for working out the Mann-Whitney U test for data set 2 is:
U2 = n1 x n2 + ½ n1 (n1 +1) – ∑R1
In the above equations;
n1 = Sample size of data set 1
∑R1 = Sum of the ranks of data set 1
n2 = Sample size of data set 2
∑R2 = Sum of the ranks of data set 2
From the table you can see that ∑R1 is 91 whereas ∑R2 is equal to 209.
Also from the table, you can see that n1 and n2 both equal 12, as there are 12 pieces of data in each set.
Therefore:
U1 = n1 x n2 + ½ n2 (n2 +1) – ∑R2 U2 = n1 x n2 + ½ n1 (n1 +1) – ∑R1
= (12 x 12) + (½ 12 (12 +1)) – 209 = (12 x 12) + (½ 12 (12 +1)) – 91
= 144 + 78 – 209 = 144 + 78 – 91
= 13 = 131
We can now look at the smallest U value (which is 13); we can compare this to the value shown in the table of critical values (fig4) where both n1 and n2 equal 12. Then when we go across and match them up, the critical value is 37. The value of U is less than that of the critical value, and then we can say that there is a significant difference between the data sets and the null hypothesis can therefore be rejected. My null hypothesis was: ‘There is no significant difference between the height measured from the light and dark areas. This would be proved only if there is no difference between the results obtained.’ This can be rejected because the light area clearly had the greater height of bracken than the darker area. As a result, the alternative hypothesis can be accepted.
Below is the table of critical values for the Mann-Whitney U test (at the 0.05 or 95% level). Critical values are the point at which the difference between the data sets becomes significant, i.e. we are 95% certain that the difference is not due to chance.
Fig4:
Soil moisture analysis:
Below is a table showing the weight of soil samples taken from coordinates within each plot of land. The weight of the samples is needed to help me to calculate the percentage moisture of the soil samples in the dark and light areas. This would give a good indication to whether the moisture of the soil in both light and dark areas was the same.
Fig5:
To calculate the weight of the wet soil, I subtracted the weight of the Petri dish from the weight of the Petri dish with the wet soil in it.
To calculate the water loss, I subtracted the weight of the dry soil and Petri dish from the weight of the Petri dish with the wet soil in it.
To calculate the percentage moisture:
Percentage moisture = water loss x 100
Original wet mass
= E x 100
C
For example:
For (0, 0) in the dark area, percentage moisture = 3.27 x100
7.61
= 42.97%
This shows that 42.97% of the soil was water, and the other 57.03% was the actual soil.
As you can see from the table above, the average percentage moisture of the dark area is 46.17% and the average percentage moisture of the light area is 33.85%. This suggests that the heat from the sunlight might have dried the water up and caused it to evaporate. This also shows that the percentage moisture of the soil does not cause the height of bracken to be greater I the area with more moisture in the soil. As a result, we can say that the light intensity is the cause of bracken being taller in the area with more light.
The level of water being higher in the dark area may have had a negative effect on the growth of bracken and as a result, caused the average height of bracken in the dark area to be even lower than that of the light area.
Discussion and Evaluation:
As previously mentioned in my analysis, the height of bracken undoubtedly increases as the light intensity also increased. This proves that the height of bracken was reliant on the amount of light being obtained by the plant. As a result, my hypothesis was correct.
The method used was satisfactory as it provided me with reliable results that could be used to analyse my hypothesis. It gave me an appropriate amount of data needed to calculate the statistical tests and obtain viable conclusions.
In the method the safety was a key element as there were many dangerous factors that had to be taken into account. I think the method I used was fairly safe and would reduce the chance of any accidents happening. A disadvantage about my method was that there were many natural hazards around. Although precautions were taken there was still to some extent a risk of getting hurt. However no one was in any danger.
A good asset of my method was measuring the soil moisture. This is one factor that would have definitely would have affected my results, but having taken measures to control the external variables as possible the results obtained were near to accurate.
Overall the method was reasonable. The results obtained gave conclusions which proved my hypothesis to be correct.
There were only 2 anomalous results. The first one being sample 4 (at 14.3, 3.1) in the dark area, as in this coordinate, there was no bracken and so no readings or measurements could be taken. The second anomaly was the height of bracken in sample 2 (at 8.2, 12.3), which gave an average of 95.75cm. I have discussed these previously in my analysis.
One point that may have lead to inaccuracies was when measuring the height of the bracken. Inaccurate readings may have been made when measuring with the metre-rule. Also related to this, another point was when measuring the leaves. They may have moved while measuring due to weather conditions and this may have also led to an inaccurate reading.
Measuring the temperature seemed to be ok, and the readings didn’t vary that much, so this variable was controlled with minimal effect on the height of bracken. However, the weather conditions could have easily changed very quickly and given inaccurate readings which would not reflect the true situation. On the other hand, the weather conditions are always changing, so in that respect if they had changed, it would give a clear indication of the type of conditions the bracken really has to put up with or which conditions they prefer.
Light intensity was the key factor in this investigation. To improve the investigation, I would have taken more light intensity readings. It would be much better to take a light intensity reading at every coordinate, as this would enable me to carry out a more reliable statistical test and give me more accurate values for Spearman’s Rank Correlation Coefficient. However, it would be very difficult to take light intensity readings when measuring the height of bracken. This is because you have to find each coordinate and take the light intensity reading, but when you take it, you will also be measuring the height of bracken. Also, when you measure the light intensity, due to the time taken between taking the readings, the light intensity might change. For example, the sun could be behind the clouds when taking one reading and when going to the next coordinate to take the next reading, the sun could appear from behind the clouds. This is why I took the light intensity readings all at once, leaving a minimal time gap between taking the readings, as the intensity may suddenly change due to weather conditions suddenly changing. By taking more light intensity readings, this would improve my results considerably and make them much more reliable.
I could also carry out another statistical test as well as the Mann-Whitney U test. This test would be Spearman’s Rank Correlation Coefficient. As the height of bracken and light intensity need to have equal amount of data to carry out this test, I would make sure I obtain an equal number of samples in order to do this. Spearman’s Rank Correlation Coefficient allows you to measure the strength and direction of the relationship between two variable. These variables would be the height of bracken and the light intensity in the area.
If there was more time available to me, I would have selected other sites to carry out this experiment, and not just used one dark area and one light area. This would have given me more results and would have allowed me to make more precise conclusions.
I think that my results are quite reliable and give a clear pattern which matches my results despite having some minor errors. If I was to carry out further work on this topic, I would definitely take more light intensity readings, although it would be difficult to take readings the same time as measuring the height of bracken and at every coordinate, as the time gap would be too great, giving an opportunity for the weather conditions to change.
There could have been a major factor in the competition for light, especially in the dark area. Due to there being less light available to the plants, there would be more competition between other species of plant (such as thorn bushes and small weeds) to gain as much light as possible in order to photosynthesise and produce the required amount of nutrients needed by the plant.
To further my investigation, I would perhaps take note of the other species of plant present in the quadrat when measuring the height of bracken. If I was to go into much more detail, I would try and work out the percentage cover of bracken and the other plants present. However, this may be difficult as the bracken leaves probably tower over the smaller plants and so gain most of the light, which would mean little competition for light by the other plant. Nevertheless, there are many nutrients to be obtained from the soil. Also, all plants need water, which would provide even more need for competition, especially if there are other plants species than just bracken, which in most cases is unlikely, but still possible. Another area of possible further study would be to see whether the level of water has a negative effect on the growth or height of bracken in the dark area.