For concentration against time graph:
- Zero order: Concentration must be proportional (inversely) to the time because the reactant is being used up and the gradient is constant.
-
First order: If the concentration is exponentially decreasing with respect to time, then the half life must be constant which tells us that the reaction is first order
- Second order: If the concentration is exponentially decreasing with respect to time, then the half life must be greater than initial half lives which tell us that that reaction is second order.
MAKING STANDARD SOLUTION:
- Zero the scale with the watch glass in it.
- Transfer the required mass of substance into the beaker.
- From the watch glass, put the measured mass into the beaker and dissolve the substance with the distilled water.
- Rinse the watch glass at least twice so that maximum measured mass is dissolved into the beaker.
- With the help of glass rod, stir it until the solid is dissolved in the beaker.
-
Transfer the solution to the volumetric flask from the beaker and rinse the beaker at least twice with distilled water.
- Add distilled water to the volumetric flask below the calibration mark and add last few drops of distilled water with the help of dropper pipette to make sure the bottom of the meniscus is at the calibration mark.
- Put the stopper on the volumetric flask and mix the solution by turning turning volumetric flask up-down or shaking.
DILUTION:
- Use a grading pipette; take the volume of the known concentration of the solution into the volumetric flask.
- Add distilled water to volumetric flask below the calibration mark and add last few drops of distilled water with the help of dropper pipette to make sure the bottom of the meniscus is by at the calibration mark.
- Put the stopper on the volumetric flask and mix the solution by turning volumetric flask up-down or shaking.
COLORIMETRY
Colorimetry is a way of determining the concentration of a chemical in a solution, if it has a color, is to measure the intensity of the color and relate the intensity of the color to the concentration of the solution.
Finding which filter to use:
Filter produces light of single wavelength (monochromatic light). Use the colour of the solution (e.g. Iodine solution is brown color) and find the filter which gives us the highest absorbance reading.
Process used in Colorimeter:
- The selected filter must opposite colour (complementary) of the solution that we are going to use.
- Colorimeter must be set to zero using a tube of distilled.
- At different interval of time, absorbance reading can be collected using different known concentration of the solution.
- Plotting the graph of absorbance against the concentration.
- Using the calibration graph, we can find out the unknown concentration of solution knowing the absorbance of the known solution.
- Plotting the graph of absorbance against time and finding the gradient giving us the rate of the reaction.
METHODS FOR EXPERIMENT 1: QUENCHING
Equipments needed:
-
1 x 10cm3 volumetric pipette and pipette filler
-
2 x 25cm3 volumetric pipette and pipette filler
- 4 Burette
-
100cm3 measuring cylinder
-
50cm3 volumetric pipette and pipette filler
-
10 x 250cm3 conical flasks.
-
Propanone solution, 1.00moldm-3 (50cm3)
-
Iodine solution, 0.02moldm-3 (100cm3)
-
Sodium Thiosulphate (VI) solution, 0.02moldm-3 (50cm3)
-
Sodium hydrogen carbonate solution 0.02moldm-3 (50cm3)
-
Hydrochloric acid, 2.00 moldm-3 (50cm3)
- Stopwatch
- White tile
-
Freshly made starch solution (2cm3)
Methods:
Steps used in “Quenching”:
-
Use the burette to measure 50 cm3 of 0.02 moldm-3 of Iodine solution into conical flask (1).
-
Use another burette to measure 25 cm3 of 1 moldm-3 of propanone solution and add 25 cm3 of 2 moldm-3 HCL( from different burette) into flask(2).
-
Using the 25 cm3 pipette, measure out the 0.2moldm-3 of sodium hydrogen carbonate into the flask (3).
-
First wash the new burette with 0.02moldm-3 Sodium Thiosulphate (VI) solution and then fill the new burette with 0.02moldm-3 of sodium thiosulfate and get the starch indicator.
- Pour the solution present in flask (2) into the flask (1) and start the stopwatch and swirl it to mix the solution.
-
When the first sampling time approaches, use the pipette (10 cm3) of the reaction mixture, take 8 samples at different time and add it to flask (3).
- Add the 2-3 drops of starch indicator to the mixture and titrate the iodine (quenched mixture) with sodium thoisulfate solution which is present at the burette.
- Titrate it until the colour of the solution turns to colourless.
- Repeat the highlighted steps of next sampling time.
- Using the titre volumes, find out the concentrations of the iodine using the equation below:
2Na2S2O3 + I2 Na2S4O6 + 2NaI
- Finally plot the graph of concentration against time.
METHODS FOR EXPERIMENT 2: ORDER OF REACTION
Equipment needed:
-
Iodine solution 0.01moldm-3 (100cm3)
-
Propanone solution 2molddm-3 (50cm3)
-
Hydrochloric solution 2moldm-3 (50cm3)
- 8 x Test tube
- Boiling tube
- 4 x Beakers
- Colorimeter
- Stopwatch
-
Pipette (5 cm3, 2 cm3, 1 cm3, 25 cm3)
Methods:
Steps used in “colorimetric”:
- I have to choose the appropriate filter and zero the colorimeter using the tube (test tube) of distilled water.
-
Using the pipette (2 cm3), measure 2 cm3 of propanone solution into the boiling tube.
-
Mix the required volume of I2 solution, HCL and H2O into 2nd boiling tube.
-
Add (I2-HCL) mixture to propanone solution and start stop clock.
- Using the dropper pipette, add some of the reaction mixture into new test tube and put it into the colorimeter.
-
Take reading in different time interval (every 30 seconds up to maximum 6 minutes) and repeat the process for other “runs” shown below:
- Finally plot the graph of absorbance against time.
METHODS FOR EXPERIMENT 3: AFFECT OF TEMPERATURE ON RATE
Equipment needed:
-
Iodine solution 0.01moldm-3 (100cm3)
-
Propanone solution 2molddm-3 (50cm3)
-
Hydrochloric solution 2moldm-3 (50cm3)
- 6 x Test tube
- 6x Beakers
- 2 x boiling tubes
- Kettle
- Ice
- Colorimeter
- Dropper pipette
- Stopwatch
- 2 x Thermometer
- Tissue (to clean the test tubes/ boiling tubes).
Method:
- I have to choose the appropriate filter and zero the colorimeter using the tube (test tube) of distilled water.
-
Using the pipette (2 cm3), measure 2 cm3 of propanone solution into the boiling tube.
-
Mix the required volume of I2 solution, HCL and H2O into 2nd boiling tube.
- Fill a beaker with boiling water (from the kettle for high temperature) and ice (for low temperature) at the required temperature and allow the two boiling tubes to sit inside for around 2 minutes.
- Take the readings of temperature with the help of thermometer of both boiling tubes.
-
As the required temperature approaches, remove the thermometer and add (I2-HCL) mixture to propanone solution and start stop clock.
-
Using the dropper pipette quickly, add some of the reaction mixture into new test tube (dry) and put it into the colorimeter.
- Take reading in different time interval (every 30 seconds up to maximum 6 minutes).
- Once you take the reading, transfer the tube to the beaker containing hot water so that the temperatures would be constant.
- 5 seconds before next sampling time, remove the test tube from the beaker and dry it (with tissue) and take the reading.
- Repeat the highlighted steps up to maximum of 4 minutes.
- After the maximum time, take the reading of final temperature of the solution.
- Repeat the steps from step 4 to step 12 for different temperature.
METHODS FOR EXPERIMENT 4: AFFECT OF CATALYST ON RATE
Catalyst used is Phenol (C6H5OH)
Equipment needed: Same equipment as experiment 2
Method: Similar method as the experiment 2 but you have to change the concentration of catalyst at given volume. (Table is shown below) Run 1: concentration of Phenol= 0.0010moldm-3
Run 2: concentration of Phenol = 0.0005moldm-3
Run 3: concentration of Phenol = 0.00025moldm-£
METHODS FOR EXPERIMENT 5: AFFECT OF CATALYST ON RATE WITH TEMPERATURE
Equipment needed: Same equipments as experiment 3
Method: Similar method as experiment 3 but you have to change volume of water (subtract 1 cm3 because you are adding 1 cm3 of catalyst (phenol).
ANALYSIS AND RESULTS
FOR EXPERIMENT 1: QUENCHING
In this experiment, we have to find out the titre volume so that we can find the concentration of the iodine giving us the idea of how the concentration of iodine varies the time. The purpose of this experiment was to monitor the reaction identifying the colour change. In this experiment the colour changed from dark blue (because the starch was added to the reaction mixture) to the colourless which was the end point. .
- Observations: At the beginning, iodine was orange/brown colour. But when adding the propanone (colourless) and hydrochloric acid (colourless), the colour slightly became lighter orange. As we transfer the mixture (iodine-HCL-propanone) into the conical flask (contains Sodium hydrogen carbonate), colour doesn’t change but the carbon dioxide gas is formed because mixture was producing bubbles. As I added the starch indicator to the solution, the colour changed from orange to dark blue and when I titrated with sodium thiosulfate, the colour starts to change from dark blue to light blue and finally to colourless (also black precipitate/residue) which shows that iodine has been quenched/was not in the solution.
RESULTS:
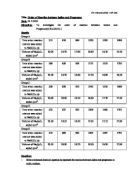
Table 1 – (Quenching)
Titre volume = Final volume – Initial volume.
Table 2 – Titre volume
Using 0.02moldm-3 of sodium thoisulfate (VI), these results gave me small titre volume which will give me higher percentage error. So I repeat the experiment with small concentration (0.005moldm-3) of sodium thiosufate (VI) which will give me high titre volume with low percentage error.
Reducing the concentration of sodium thiosulfate (VI) to 005moldm-3.
- Observations: Same observation as before.
To dilute from 0.02moldm-3 solution to 0.005moldm-3: Firstly I found out how much of 0.020moldm-3 solution is needed.
= 0.025 0.25 ×1000cm3 = 250cm3
Because 1000cm3 is equal to 1 litre
Then use a pipette (25cm3) to transfer 25cm3 of 0.02moldm-3 solution of sodium thiosulfate. Add distilled water just below the calibration mark and use dropper pipette to add few drops of distilled water making sure that the bottom of the meniscus is on the calibration mark. Put the stopper and invert the volumetric flask and shake it. And I have 0.005moldm-3 of sodium thiosulfate.
RESULTS:
Table 3 – (Quenching)
Table 4 – (Quenching)
Table 5 –Titre volumes and average time
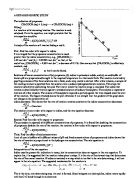
As shown in the calculation, I found the concentration of all the titres shown below:
As I plotted the graph 1, it showed that the concentration of the iodine decreases as the time increases because the iodine is used up giving the constant gradient (negative) showing the zero order. As the gradient is constant, the rate (gradient) against concentration graph (graph 2) is straight line parallel to x-axis and this concludes that iodine is zero order.
FOR EXPERIMENT 2:
Observation: The colour of the Hydrochloric acid (HCL) was colourless and when I add the iodine (brown/orange) to the tube containing HCL, the colour change to slightly light orange. Then I transfer the propanone solution from another test tube to the tube containing the mixture, and as I started to take the absorbance readings, the colour changed from orange to colourless at the end.
For iodine:
Note: Absorbance reading is at 580 nm for all coloromertry.
Average For iodine:
For Hydrochloric acid (HCL):
AVERAGE FOR HCL:
For propanone:
AVERAGE FOR PROPANONE:
AS shown in the calculation, I found the rate of all reactants.
For iodine:
For HCL:
For propanone:
Looking at my results, rate is negative which tells me that reactants have been used up in the reaction.
Looking at the graph 3, the gradient is parallel. So, when I drew the rate(gradient) against concentration graph, it came up to be a straight line parallel to x-axis on graph 6. Therefore, iodine is zero order.
Looking at the graph 4 and 5, the gradient of the graph is increasing with respect to time. So, when I drew the rate(gradient) against concentration graph, it showed that rate is proportional to concentration( on graph 7 and 8). Therefore, HCL and propanone is first order.
In sheet 3 I have show how to find out K from the rate equation.
MECHANISM:
Looking at the rate equation, we can find out the rate determining step (slowest step). For my rate equation, the rate determining step is when propanone and H+ ions reacts where iodine doesn’t takes part in slowest step because iodine is zero order. The mechanism is show in sheet 4.
FOR EXPERIMENT 3
Observation: same observation as in experiment 2 but at high temperature the colour changes from orange to colourless faster and at low temperature the colour changes from orange to colourless slowly.
My results for the temperature are below:
THIS COLORIMETER IS AT ABSORBANCE OF 440NM.
For the Arrhenius equation where I have to plot the lnK against the 1/temperature graph
For Experiment 4:
Observation: For my experiment I used phenol as a catalyst. The observation was same as in experiment 2.
But this catalyst didn’t affect the rate of the reaction. At graph 9 the gradient is constant and at graph 10 it shows the line is parallel to x-axis which tells us that it is not a catalyst or catalyst didn’t work.
Results for my experiment:
For phenol:
For Experiment 3:
Observation: For my experiment, observation was same as experiment 2. Same colour change as the experiment 3.
My results are below.
For the Arrhenius equation where I have to plot the lnK against the 1/temperature graph
Looking at the graph thirteen, the gradient of the line without the catalyst and with the catalyst is parallel which shows that catalyst didn’t affect the rate of reaction and the activation energy is about the same. I have shown how to calculate the activation energy in sheet 5 below:
EVALUATION:
Errors:
Equipment errors:
-
Burette ‘class B’ error:
Equipment error of mean titration volumes.
I have shown how to calculate the percentage error in the sheet 6.
With high percentage errors due to small volumes these results were not used.
Average titration volumes
The larger titration volume is, the smaller the percentage error is. Equipment should not pose much of a threat in causing error at worst for titration volume 13.70cm3 the volume will be off (due to equipment) by approximately ±0.20cm3.
10cm3 volumetric pipette ‘class B’
(0.04/10cm3) x 100 = 0.40%
25cm3 volumetric pipette ‘class B’
(0.06/25cm3) x100 = 0.24%
50cm3 volumetric pipette ‘class B’
(0.10/ 50cm3) x 100 = 0.20%
Overall error for diluting 0.02moldm-3 sodium thiosulphate using 1 litre volumetric flask ‘class B’.
Using volumetric pipettes (((2 x 0.12) + (0.10))/250) x 100 = 0.136%
Using volumetric flask (0.8/1000) x 100 =0.08%
Overall error= 0.136% + 0.08% = 0.216%
Overall, the equipment error is not a huge factor affecting values given for titration volumes mainly applying to larger volumes.
Human errors/ other errors:
- A ‘readymade’ from the lab solutions. I could have made the solution myself.
- There may be contamination in the equipments that I use like conical flasks/ beakers/ dropper pipette. I could have use a new equipment or rinse the equipment properly with the solution that I will be going to use.
- Delaying when taking the time . I could have asked my friend, to start the stop clock as I pour the propanone to iodine-HCL mixture.
- Determining the end point of the reaction. I could have used clean white tile under the conical flask which would let me see the colour clearly.
Most human error is when I have to determine the end point which is hard to tell.
For Colorimetry
From the table above it is clear that the graduated pipette is up to 10 times more accurate than the dropper pipette.
Human errors/ other errors:
For temperature:
Human errors/ other errors:
- Same as above experiment.
- Make the temperature constant because it is very hard to make the temperature same for the reaction. I should have used a water bath to make the temperature more stable/constant.
REFERENCE:
Effect of temperature on the reaction rates:
Collision theory: