This equation is true as long as the elastic limit of the spring is not exceeded
My Method
- I am going to collect clamp, spring (at constant speed of 23 N/m), some mass and a stopwatch
- I am going to set up my experiment on the desk, safely away from other pupils.
- I will carefully start the experiment starting at 100g (0.1kg) with the stopwatch ready and then take the note of result. I will then continue at every hundred grams (0.2, 0.3, 0.4….) with the maximum of 2kg. I chose to do every gram so there will be less time to do the experiment and more range up to 2 kg.
- I will stop the watch when the mass had reach ten oscillate,
I am going to measure the time in seconds for measuring the mass at ten oscillates. I then will be able to observe the results on the graph and may discover a pattern.
I will use the stopwatch to measure the time in seconds (s)
My Plan
My plan to do this experiment is to find out how the mass on the end of a spring affects the time periods for ten vertical oscillations.
My first step is to collect my apparatus
Spring Clamp Mass Stop watch Desk
I am then going to prepare the experiment on the desk and I will make sure it is safely away from other pupils. I then will start the experiment carefully starting from 100g (0.1kg) with the stopwatch and then continue after every hundred grams (0.2, 0.3, 0.4…) to the maximum of 2kg.
I will stop the watch when the mass reached ten oscillate. If needed, I will make the experiment in detail in halves (0.15, 0.25, 0.35.). This will help me to find more reliable results.
Label Diagram of The Experiment
To make sure my results are reliable, I will repeat the experiment with the same spring that I used in previous experiment and same design of the stopwatch. I may need to compare my result with other pupils to see if my results are similar. This will save some time.
If I obtain some odd results unexpected, I would may ignore it or repeat the experiment (If I got some extra time).
The apparatus I am going to used are
- 23 N/M spring
- 2kg in 100g mass
- 1kg in 50g
- Clamp
- Stopwatch
- Desk
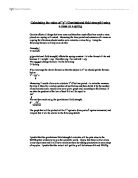
Analysing Results / Conclusions
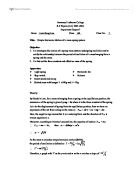
In this experiment, I have to do some mathematics. I need to calculate the formula (equation)
For mass on spring where m= mass (0.1kg to 2kg)
K is spring stiffness (a constant speed for the spring = 23N/m)
I have two odd results and the odd results come from 0.3 and 1.2. I would need to ignore it as it is only slightly off the results (Graph Curve)
When I finished plotting the graph, I noticed there is a pattern. The pattern was a curve almost identical to the formula , which suggest that my experiment was nearly successful.
I found out that my results telling me that the bigger the mass is, the time period for ten oscillate increases. I got table of results to prove that time period for ten oscillates increases as the mass increases. I also got a graph to prove that the gradient of the line climbing up as the time period increase=masses increase. The conclusion of the experiment matched to my predication as I said “the heavier the mass are, the time period will increase for ten oscillations”.
As I said, the conclusion matched to my original predication. I cannot think of any other explanation to what I have found out in this experiment apart from that when the mass increased, the time period for ten oscillations increases.
I think my results are not 100% success. It isn’t success due to a couple of odd results and my data didn’t matched to the formula. In other hand, the results are success were very close to the formula’s result that is acceptable to me because it is good enough to produce the graph and to analyse the results.
I think that my results are accurate as my graph produced almost identical to the formula’s results.
I did a fair test as I used same spring each time I did the experiment and I used same design of the stopwatch. In the result of the fair test, they produce same output of results (apart from the difference in mass).
I could improve the accurately of my results by starting the spring at constant speed of 23 N/m. I have noticed that in previous experiment, I let go the spring by force which in results of different speed to other time when I let the gravity to do the work. In the result of my mistake, the result may be odd, which suggest why I may have some odd results in my table of results.
I have obtained a couple of odd results. I may get them by letting the spring go by my force or letting the spring go too late or too early. To make odd results accurate, I would need to do the experiment again. As they are not important as my graph produce acceptable line and I guess, I would ignore the odd results.
I think I just got enough results to be certain that my conclusion is accurate because I think I analyse and obtain good results. I have also produce a very good graph. If I need to obtain any more results, I would do an experiment for masse sin 50g e.g. (0.15, 0.25, 0.35…). In the results of that I would be able to produce a better graph as there is more results to analyse from and likely to produce a better conclusions. Above of all, the results are likely to be more accurate and reliable. It will help to improve the rate of this experiment.