Active Transport.
Active transport requires the expenditure of energy to transport the molecule from one side of the membrane to the other, but active transport is the only type of transport that can actually take molecules up their concentration gradient as well as down. Similarly to facilitated diffusion, active transport is limited by the number of proteins present.
Plant that should be investigated.
Beta vulgaris is of the goose root family Chenopodiaceae. The skin and flesh colour are red/purple. I have decided to investigate Beta vulgaris as it is one of the few plants that has coloured pigments within it. The two main pigments are anthocyanins and betacyanins.
Betacyanins and Anthocyanins.
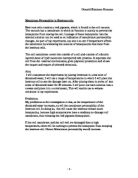
It is also important to find a suitable plant to investigate the permeability of plant cells. Beta vulgaris is a suitable candidate as beta vulgaris contains large amounts of betacyanin, a red pigment, located in the large internal membrane vacuoles. One of the types of vacuoles found in plant cells is quite large and usually contains water. It is surrounded by a membrane called the tonoplast. In beet plants, this membrane bound vacuole also contains a water soluble red pigment, betacyanin, that gives beta vulgaris its characteristic colour. Since the pigment is water soluble and not lipid soluble, it remains in the vacuole when the cells are healthy. If the integrity of a membrane is disrupted however the contents of the vacuole will spill out into the surrounding environment. This usually means the cell that made the vacuole is dead. Figure 3 is a representation of the chemical structure of anthocyanins. These are flavinoids.
Plant Cell Wall.
Plants do not just have membranes they also have cell walls which are made up of cellulose mainly, there is a primary wall and a secondary wall. This makes up approximately 50% of the cell wall, it is a polymer of about 10,000 beta glucose molecules forming a long, unbranched chain with cross linkages between one chain and the next. This gives a great deal of stability to the structure of plant cells. It is important to remember that the betacyanin molecules will have to be able to come through both the membrane and the cell wall.
Colorimeter.
If beet membranes are damaged, the red pigment will leak out into the surrounding environment. The intensity of the colour in the environment should be proportional to the amount of cellular damage sustained by the beet.
To measure colour intensity an instrument that is used a lot is the colorimeter. Colorimetry is a measurement of the wavelength and intensity of electromagnetic radiation in the visible region of the spectrum. It is used extensively for identification and determinations of concentrations of substances that absorb light. In this device, blue light from the LED light source will pass through the solution and strike a photocell.
A higher concentration of coloured solution absorbs more light and transmits less light than a solution of lower concentration. The computer interfaced colorimeter monitors the light received by the photocell as either an absorbance or as a percentage transmittance value.
The Problem.
The purpose of this investigation is to illustrate the effects that temperature have on the cell membrane.
Prediction & Hypothesis.
I predict that as the temperature is raised the number of molecules that are able to leave the cell and come into the solution will increase, however I think that there will be appoint at which the amount of molecules coming out will remain constant.
Red beet tissue contains large amounts of betacyanin, a red pigment, located in the large internal membrane vacuoles. When the membrane is damaged, the pigment can cross the vacuole membrane and cell membrane. Since pigment is water soluble and not lipid soluble, it remains in the vacuole when the cells are healthy. If the integrity of a membrane is disrupted, however, the contents of the vacuole will spill out into the surrounding environment. This usually means the cell that made the vacuole is dead.
However, at low temperatures such as 250C it is not possible that plant cell membranes are disrupted, even though pigment molecules do still move out of the membrane and into the solution. This is because facilitated diffusion is occurring, as facilitated diffusion occurs via permeases and protein channels , we would expect results to be similar to that of any enzyme graph. As expressed above the characteristics of facilitated diffusion resemble enzymes in catalysing biochemical reactions. Indicating that facilitated diffusion is carried out by membrane proteins with similar properties to those of enzymes. Therefore, one can expect that as the temperature increases the more betacyanin molecules are released from the membrane and into the solution. At low temperatures the molecules have little kinetic energy and collisions are few, so the rate of the reaction is slow, such as 20 and 250C. As the temperature rises the molecules have more energy, move faster and more collisions occur: the rate of the reaction increases Thus a straight line is expected.
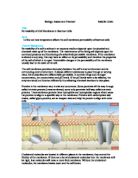
However, at 45OC, it is expected that the protein begins to denature, therefore the rate should decrease. This however, does not happen because even though facilitated diffusion is no longer occurring the membrane and cell wall get disrupted, due to the weak interactions, i.e. van der Waal’s forces and dipole-dipole interactions breaking. As these bonds break, the pigment molecules gush out into solution rapidly. So as you increase the temperature between 45OC and 65OC there is still a constant rise in pigment loss of the beta vulgaris, this should be again a proportional rise, so as the temperature increases the concentration will increase too, shown by a straight line.
After this point though, there should no longer be a rise in concentration of betacyanin molecules as 65OC is referred to as the death-point of the cell, where the membrane and vacuole are disrupted completely. So one expects that at higher temperatures there will be a levelling off on a concentration against temperature graph. An example of the type of graph expected is shown below.
Variables.
Age of beetroot.
The age of the beetroot needs to be controlled as to prevent inaccuracies. The older the beetroot the more betacyanin and anthocyanins molecules present. This will therefore make the experiment unfair, because the more pigment molecules present the more pigment molecules that can move out of the cell. Therefore the beetroot used should be freshly cut.
pH
The pH is also an important factor, as pH can have an effect on the weak interactions and bonds that bound the membrane together. To keep the pH constant it is important to make sure that the same surrounding are used for the experiment.
Surface area.
The surface area of the beta vulgaris is another important factor as the greater the surface area of the beta vulgaris, the greater the concentration of pigment molecules the beta vulgaris will hold. It is therefore important that all the pieces of beta vulgaris used be of the same length and diameter.
Light intensity.
It is important that the investigation is carried out in the same light intensity because the absorption will be different for different intensities.
Colorimeter.
The same colorimeter should be used throughout the experiment to make sure that the accurarcy to which the results are given are of the same degree. Also, it is important to use the blue filter at all times as this gives the % light transmission of 0.
The solution into which the pigment molecules diffuse.
This is also a variable that needs to be controlled, organic solutions such as ethanol are also disruptive for the plant membrane, and therefore it is best to use a neutral kind of solution, such as water. I will use distilled water throughout the experiment so that the investigation is kept fair.
The variables that I will control are the ones listed above, the one that I am going to investigate is temperature I will increase the temperature in 5OC intervals.
Apparatus & Materials.
- Colorimeter
- Beta vulgaris- length 3cm, diameter 0.8cm
- Distilled water
- 2 x Cuvettes per temperature
- Test tube rack
-
Test tubes x 2 per temperature
-
Water bath for temperatures between 20 and 85OC.
- Cork borer
- A 5cm3 syringe
- A 10cm3 measuring cylinder.
- A 250 cm3 beaker
- 2 x 100cm3 beakers
- ceramic tile
- Bunsen burner, mat, tripod, gauze.
- Thermometer
- Safety goggles
- Lab coat
- Knife
- Ruler
- Forceps
- Pestle & mortar
Potential Hazards.
- Safety goggles should be worn at all times, as hot water is being handled in the experiment.
- Lab coats are also important due to the heavy staining of beta vulgaris.
- Hair should be tied back due to the use of Bunsen burners.
- Bags should be kept under tables so that no one trips and falls.
- The use of sharp instruments, such as the knife is also considered as hazardous.
- The Bunsen burner is a potential hazard, it is important to keep a close eye on the apparatus being used at all times.
Method.
Set up a Bunsen burner on a mat, a tripod and a gauze.
Heat 200cm3 of distilled water to temperatures between 20OC and 85OC in a 250cm3 beaker.
Whilst the water is being heated the other partner should measure out 6cm3 of distilled water using a 10cm3 measuring cylinder. Measure out 6cm3 for two test tubes per temperature, and label them by temperature.
Cut 2 pieces of beta vulgaris, per temperature, length 3cm
When the water is at the correct temperature place in the pieces of beetroot into the beaker of water. Start the stop watch simultaneously.
After one minute, use forceps to transfer the pieces of beetroot into the appropriate test tubes. Note the time.
Leave each piece of beetroot in the distilled water at room temperature for 30 minutes exactly.
After the time has elapsed, shake the test tubes and place the two solutions in separate 100cm3 beakers.
Remove the beetroot.
Syringe 3cm3 of solution and pour directly into the Cuvettes.
Using a colorimeter compare the amounts of red pigment which have diffused out of the beetroot and into the water.
Repeat this for all the temperatures, i.e. 20. 25, 30, 35, 40, 45, 50, 55, 60, 65, 70, 75, 80, 85OC.
The Calibration.
A calibration is carried out due to the fact that it is not possible to measure the exact number of betacyanin molecules, and thus are unable to work out the permeability.
It is thus important to obtain a set of values experimentally.
This can be done by following the procedure below:
Make a highly concentrated solution of beetroot pigment using a pestle and mortar.
Set the colorimeter on the blue filter.
Pour 3cm3 of distilled water into a cuvette and put into the colorimeter.
The light transmission should come to 100%
If so proceed, otherwise use the button that resets it, until it does read 100% with distilled water.
Then measure out the amount of pigment solution that has been made and pour the measured amount in to the cuvette.
Put this into the colorimeter, the light transmission should come to 1%. This solution is said to be 100 arbitrary pigments.
Using a small syringe remove half of the solution from the cuvette and replace with distilled water.
Take a second reading using the colorimeter, write this down and this solution is said to contain 50 arbitrary pigments in it.
Carry on diluting the solution by a factor of a half and record the transmission values.
The calibration now enables you to evaluate your results, hence by reading the% light transmission values of the calibration graph, the number of arbitrary units lost for each temperature can be defined.
Order & Scale of working proposed.
I have decided to take one repeat reading for each temperature, therefore two pieces of beetroot are being used per temperature.
The volume of water being used within the test tube is 6cm3, so that it covers the beetroot.
I am leaving the beetroot to diffuse over 30 minutes.
The surface area of the beetroot can be worked out, as the length is 3cm and diameter is 0.8cm, therefore it is 2.4cm2
I have carried out the investigation between the temperatures 20 and 85OC, with a 5OC interval between each.
Precision & Accuracy.
Measuring Equipment used
Stopwatch: this reads time to the nearest milli-second.
Thermometer: this reads to the nearest OC.
Ruler: Measures to the nearest 0.5mm
10cm3 Measuring cylinder: measures to the nearest 0.5cm3
5cm3 syringe: measures to the nearest 0.2cm3
Colorimeter: measures to the nearest 1%
Raw Data.
Results.
Filter test results.
From this it can be seen that the blue filter it the one that should be used throughout the experiments.
Calibration Graph Results.
Results tables.
Results of conversion of % light transmissions into arbitrary pigment units, using the calibration curve.
Degree of precision.
Readings were taken as accurately as possible, using the apparatus at hand. For example when using the measuring cylinder, or filling up the beakers with water, I made sure that the bottom of the meniscus touched the line marked 250ml, or 6ml.
Also, by looking at this point from several different angles, i.e. the use of parallax, to give me the most accurate measurements possible.
Also I waited until the colorimeter balanced at one particular % before writing down the reading.
The beetroot was cut against a ruler which reads to the nearest 0.5mm, also, when cutting two pieces of beetroot I cut the two pieces simultaneously so that less error would be brought to the experiment.
In these ways I tried to gain the most amount of precision from the apparatus available.
Before embarking on the actual investigation, preliminary experimentation was done, as to find out what sort of apparatus should be used and whether modifications would be needed for the method to work.
Checking the apparatus.
The colorimeter was one of my main concerns, as I was uncertain as to which filter needed to be used, how accurate the colorimeters were and their general usage.
From this it became apparent that the filter that needed to be used was the blue filter, this is because it is the only filter that gave 0% transmission. I was also able to decide which colorimeter to use, I decided to use the one that gives a digital % reading, as there was only machine error with this particular colorimeter. The other colorimeter meant that there would be machine error and reading error, as it was on a scale.
Also I realised which way in the cuvette was supposed to go, I found that the light is supposed to be able to go through the clear sides of the cuvette, therefore you are only allowed to hold the cuvette on the ribbed sides.
All other apparatus I was familiar with and therefore did not need to use them in my preliminary experimentation.
Problems with my original method.
From my preliminary experimentation I became aware of several problems. Such as How much solution needed to go into the cuvette?
How would I manage my time if I was to set up only one temperature at a time?
Should I use test tubes or boiling tubes?
Should I increase the temperature 10O at a time or 5O?
How many repeat readings do I need?
How long should I incubate the beta vulgaris pieces in the water bath for?
What amount of water should I submerge the beetroot pieces in after incubating them?
What size, i.e. surface area should the beetroot have?
Modifications-proposed, carried out and evaluated.
I decided to try out different amounts of solution in the cuvette, and found that the cuvette needed to be three-quarters full to give a good reading, more than this meant the solution would spill out and cause the colorimeter to give inaccurate results. I therefore decided the best amount to use was 3ml worth of solution.
This amount worked best as none of the solution spilt out of the cuvette and secondly, as there was enough to give decent readings.
At first I thought that me and my partner would do each reading together, however, this was unattainable it would take too much time and all the results needed would not be obtained.
This also worked out well, as we were able to finish all our results early, and therefore had time to repeat some of the anomalies, we thought had occurred.
At first we were going to use boiling tubes as they have a larger surface area, however, we found that it was difficult to cover the beetroot fully with solution when using a boiling tube unless large amounts of water were added, I therefore decided to use test tubes.
I don’t think this made much difference to the experiment, as it was possible to use boiling tubes and receive conclusive results.
I increased the temperature by 5OC and waited to see whether there was a significant difference in % transmission readings, as there was I thought it best to increase the temperature at 5O intervals. At the same time I set up two repeat readings, as I found that the % transmission values were fairly similar, I found that it would be acceptable to do only one repeat reading.
This was an important modification, as it meant that we had more readings, so it is easier to find the anomalous results.
The incubation period was of somewhat concern to me, I was unsure as to whether the beetroot should be left in a water bath all the way through the experiment or just for a small amount of time at the beginning of the experiment. I found that it was sufficient to leave the beetroot in the water bath for one minute at the beginning.
I think this also helped to give good results.
At first we were going to use beetroot of length 5cm, however, we found that none of the pieces were long enough to be able to experiment with this length, we therefore decided to change the length to 3cm. Alongside this we thought it wise to change the amount of water the beetroot was submerged in, from 10ml initially to 6ml.
It was best to change the length of beetroot being used, otherwise very little results could have been obtained as very few pieces of beta vulgaris were 5cm long. Even though it was not necessary to change the amount of water that the beta vulgaris is submerged into, it was more appropriate to use less water.
Reliability & Accuracy of data.
The reliability of data and its accuracy are dependant on the apparatus used, and its accuracy.
The apparatus used was adequate to give conclusive results. However, the results attained are unable to give a decisive conclusion as to whether the prediction and hypothesis stated are correct.
Also, as there were errors in the investigation, this is what led to anomalies, so even though the equipment used such as the stopwatch, measuring cylinders and ruler read to a good accuracy, they are still able to cause a considerable amount of error in our results.
The highest difference between our repeats was 6% which is quite high and thus suggest that there were a number of inaccuracies, however, at the same time it is important to mention that four of my results, at different temperatures came out as exactly the same reading, which shows that the experiment has its shortcomings however, can still give conclusive and fairly accurate results.
The reliability and accuracy would be expected to be high as the equipment measures accurately, however it is important that even more accurate equipment be used to alleviate sources of error.
Sources of Error.
The main source of error was the colorimeter itself, firstly, it was unable to remain on a constant percentage for very long. At times it would give the % transmission of water as 98 or 101%. Which shows that it had tendencies to give inaccurate results. Also I think that as many people were using the same colorimeter and spillages did take place it is possible that water went into the colorimeter which would raise an obvious source of error.
Other sources of error were mainly to do with keeping temperature constant, as many people investigated the effect of temperature, the actual temperature at which beetroot was at was higher than it was supposed to be.
Also in many cases there was no way of telling how old the beetroot was, as it was supplied to the various group, this may have been one of the main sources of error.
Other sources of error include the measuring equipment used, these also bring their individual sources of error to the investigation.
Modifications to carry out.
Modifications that can be carried out to overcome these sources of error include:
Use of MICROMETER: this is a measuring device used to give accurate diameters and lengths of small objects in general. Using this to work out the surface area could be one modification. If the surface area is out by over a certain area it should not be used in the investigation.
Use of Graduated Measuring Equipment: All the measuring cylinders, flasks and beakers should be graduated so as to know their exact amount of error, if more accurate measuring equipment can be found it should be used.
Use of Thermometer with more accuracy: The thermometer used was reading to the nearest degree, it is best to use a thermometer that can read to at least 0.5 degrees.
Age of Beta vulgaris: It is also important that the age of the Beta vulgaris is known so that all the pieces used can be of the same age, so that there is no inaccuracy. A possible way would be to measure it, the older it gets the less water it has in it therefore its mass will be less.
Surroundings: Keep the temperature constant this can be done by carrying out the experiment in one room only.
Use of spectrophotometer: In Colorimetry frequently the entire visible spectrum is used, and consequently the complementary colour of the one absorbed is observed as transmitted light. If a monochromatic light is used, like in a spectrophotometer, it is not limited to the visible spectrum.
Conclusions.
From the results that I have obtained and the graphs that have been drawn it is true to say that they lie fairly close to my prediction, however, there are three anomalies and it is not possible to say whether my prediction and hypothesis are correct unless further experimentation takes place.
From the results you can see that the % transmission increases mostly, in the way that I suggested, slowly and then rapid increase. From this it was then possible to see what the pigment loss was like, this also showed mainly an increase in pigment loss the higher the temperature gets. However, there were some anomalous results which stem from the inaccuracies in the method of experimentation.
Data Explained.
I predicted that the first part of the graph would show a similar graph to that of an enzyme reaction, i.e. a straight line. This is shown by my best fit line, however, it was unexpected that its gradient would be so low. This happened because at lower temperatures facilitated diffusion is carrying pigment molecules across the membrane via permeases. However, this denatures as it is a protein at temperatures around about forty five degrees. My best fit line shows that at forty five degrees the rapid increase in pigment loss takes place.
Then I expected a further increase in pigment loss due to the weakening bonds of the membrane and finally, its total disruption, which would also be a straight line, as the relationship is proportional. However, my graphs show the rise to be steeper than I expected. Also, I expected the death point of the cell to be approximately sixty five degrees, however it seems to be seventy five degrees by my graph.
At the end I was expecting the graph to level off as no more pigment could possibly come out, this is where my main anomaly relies, as my graph shows that the pigment loss went down at this point. This I think is untrue and must be where my main sources of error come in.
Trends.
The main trends are those expressed above. I.e. that of the graph structure. However, I had several anomalies, at 65OC, 80OC and 85OC.
The general trends expressed are those in my prediction, apart from the last two results. This is probably due to errors in the colorimeter and age of beetroot, mainly, or to do with some human error.
At 75OC I get the death point of the cell to be reached, higher than expected.
It is at 450C that the rapid loss in pigment begins this must be when the membrane and cell wall of the beta vulgaris become disrupted.
Comparisons.
The shape of the graph expected is similar however, there are several differences, and I have only been able to see the general pattern emerge. The disrupting of the cell was predicted at 45OC and was found to lie at45OC according to my graph. However, I expected the death point of the cell to be lower than 75OC, I expected it to be 65OC.Also. I was expecting levelling off at the end of the graph once all the pigment had come out however, my results seem to have been affected by the source of errors. Other explanations could only be discussed after further experimentation.
Hypothesis and Data.
Even though there is a link between my prediction and that of the data collected, it is difficult to say whether my hypothesis is correct, this can only be found out by further experimentation. Further experimentation would include repeating this experiment with the modifications suggested and a look at further factors that should affect the permeability of plant cells. One example would be to look at other plant cells apart from Beta vulgaris, or to loo at how factors such as surface area and age of Beta vulgaris affect the permeability of their cells.
Bibliography
Internet
Britannica
Sotm LAB : B14
Various Factors affecting Cell Membranes.
Transport through cell membranes.
Structure of anthocyanins.
Books
Britannica Encyclopaedia
Mc Graw Hill Encyclopaedia of Science & Technology
J.L. Hall Cell Membranes and Ion transport
Harold. H. Hillman Certainty and uncertainty in Biochemical techniques.
Magazines
Biological Sciences Review
New Scientist