
What are the kinematic factors of performance in sprint starting?
What are the kinematic factors of performance in sprint starting? Introduction Hamill and Knutzen, (1995) sate that: Kinematics is concerned with motion characteristics, and examines motion from a spatial and temporal perspective without reference to the forces causing motion. A kinematic analysis involves the description of movement to determine how fast an object is moving, how high it goes, or how far it travels. Thus, position, velocity, and acceleration are the components of interest in a kinematic analysis. The purpose of the sprint start is to give the athlete an advantage by providing an efficient mechanism to assist them in moving in the intended direction. It enables the sprinter to start the race with his/her body sloping as required for acceleration. (McNeill Alexander, 1992, cited in Harrison and Comyns, 2005.) The start is an important part of a race however, it is not a separate entity and must be thought of as being an integral part of the overall race. The overriding principle is that it allows the athlete, if executed properly, to leave the blocks on balance and with maximum velocity. A crouched start is more effective than a standing start as it places the sprinter in a position to move the centre of gravity rapidly well ahead of the feet and thus the runner must accelerate very quickly or else fall. (Adrian & Cooper, 1995, cited in Harrison and

The aim of this investigation to see the strength of an electromagnetic by varying many variable, and seeing how this affects the performance of the electromagnet.
Physics coursework Aim The aim of this investigation to see the strength of an electromagnetic by varying many variable, and seeing how this affects the performance of the electromagnet. Variables there are many variables which can increase or decrease the magnetism of the electromagnet. these are the following variables:- Number of coils:- the more the number of coils the more the electromagnetism because, each coil creates a magnetic field. So the more coils the more magnetic fields thus the magnetism increases. Current:- this will increase the number of electrons going around the electromagnet therefore increasing the amount of magnetism. Distance:- the distance the electromagnetic is away from the target object will also decrease the magnetism. Type of iron core:- the material of the iron core could dramatically change the amount of magnetism. Length of nail:- The length of the nail will be a controlling factor, because the longer the nail is the more coils can be fitted around the nail, thus making more magnetic fields, and increasing magnetism. Length of wire:- The longer the wire is, the more oppurtunity for making more coils and increasing magnetism. Also the longer the wire is, and the number of coils increase, also their will be more electrons available to travel around the iron nail, therefore increasing magnetism. Thickness of wire:- The thicker the wire
Investigate how the static force exerted on the front axle varies with the vertical load applied to the rear end
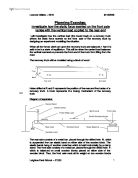
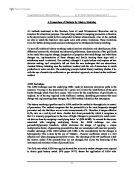
Planning Exercise: Investigate how the static force exerted on the front axle varies with the vertical load applied to the rear end I will investigate how the vertical load (the towed load) on a recovery truck affects the static force exerted on the front axle of the recovery truck by designing an experiment modelling the situation. When all the forces which act upon the recovery truck are balanced, then it is said to be in a state of equilibrium. This will be when the carried load balances the vertical load and so prevents the front end of the truck from lifting from the road. The recovery truck will be modelled using a block of wood: Holes drilled at R and F represents the position of the rear and front axles of a recovery truck. A hook represents the towing mechanism of the recovery truck. Diagram of apparatus: The rear axle consists of a metal bar, placed through the drilled hole R, which is suspended from an elastic band on either side of the wooden block. The elastic bands hang of another metal bar which is held horizontally by a clamp stand. The front axle consists of a metal bar, placed through the drilled hole F, which is balanced on small wooden blocks placed on either side of the wooden block. Thus, the front axle rests all its weight on two wooden blocks placed on a mass balance. The fixed load is supplied by placing two 100g masses on the wooden block at

Elastictvy of Copper investigation
Elasticity of Copper investigation In this experiment I will investigate how the extension e of a length of copper wire changes as the stretching force F is increase. The question I will be answering is: "If a wire whose original length was L is subjected to a stretching force F then will the wire increase in length by the amount e" The aim of this experiment is to investigate how the extension of a length of wire is affected by the force. I will then find stress and strain after finding these variables, for which I can finally complete my objective which is to find the young's modulus for the material, in this case copper wire. My aim is to measure the extension in a piece of copper while consider safety precautions and accuracy. For the experiment I will have to also consider the accuracy of both my equipment and the degree of accuracy for my results. Furthermore I will have to find a suitable range of results so that I can form a reliable basis for my conclusion, also so to allow me to show a clear set of results on a graph so that I can identity the trend. Hypothesis I predict that when a wire is subjected to a stretching force, in this case wire being pulled by the force of weight, then the wire likely to be stretched. This does depend on the material as the more flexible the material is the more possibility there is of stretching. I think that the copper wire will
A Comparison of Methods for History Matching.
A Comparison of Methods for History Matching All methods mentioned in this literature, have all used 3Dimensional Streamline and its simulator for simulation purposes. The underlying method is assigning parameters or function to the streamlines to match its flow and predict its future advancements. Also, all the methods are able to match the historical rates quite wells with certain limitations. These limitations allow for further developments and new techniques to be introduced to history matching. To start off, traditional history matching method involves simulation and identification of the difference between the simulated and observed performance, determination of the grid block in the model that requires change, designation of properties that need change and what those changes are, implementation of those changes and finally iterating these steps until a satisfactory result is achieved. This method, although it is quite tedious and requires ad hoc decision making, isn't completely left out from the new techniques that use streamlines. Assisted History Matching uses the traditional method with the aid of streamlines to match production or water-cut data. The underlying principle behind history matching whether it be with the use of sensitivity coefficients or geo-statistical approach, are based on the traditional method. AHM Technique The AHM technique uses the

Rules and Laws in Football
Rules and laws of football Without rules and laws no sport would be able to exist as a particular order must be kept while playing every sport whether it is football, netball, wrestling or swimming. In this section of the coursework I will explain the rules of football and the responsibility of the officials. I will start by looking at, arguably the most important part of the game, where football is played. The Field of Play Field Surface Matches may be played on natural or artificial surfaces, according to the rules of the competition. The Field of Play and appurtenances shall be as shown in the plan above:- Dimensions The field of play must be rectangular. The length of the touch line must be greater than the length of the goal line. Length Minimum 90 m (100 yds) Maximum 120 m (130 yds) Width Minimum 45 m (50 yds) Maximum 90 m (100 yds) Field Markings The field of play is marked with lines. These lines belong to the areas of which they are boundaries. The two longer boundary lines are called touch lines. The two shorter lines are called goal lines. All lines are not more than 12 cm (5 ins) wide. The field of play is divided into two halves by a halfway line. The centre mark is indicated at the midpoint of the halfway line. A circle with a radius of 9.15 m (10 yds) is marked around it. The Goal Area A goal area is defined at each end of the field as
Aims: 1. To record changes in species composition from a grassland to a woodland.2. To record changes in height of the ground at metre intervals
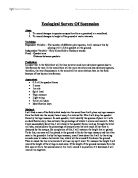
Ecological Survey Of Succession Aims: . To record changes in species composition from a grassland to a woodland. 2. To record changes in height of the ground at metre intervals. Variables: Dependent Variable - The number of different plant species, I will measure this by placing a 0.5 x 0.5m quadrat on the ground. Independent Variable - Holy Cross field to Duxbury woods. Fixed - Quadrat area Distance between quadrats Prediction: I predict that in the field there will be less variation and more dominant species due to interference by man. In the wood there will be more variation and less dominant species, therefore, the rate of succession in the wood will be more obvious than on the field because of less human interference. Apparatus: * 0.5 x 0.5m quadrat frame * 2 canes * 1m rule * Spirit level * Tape measure * Light string * Toilet roll tubes * Identification keys Method: I will find a area of the field which leads into the wood then I will place my tape measure from the field into the wood, then at every 1m interval for 20m I will drop the quadrat frame by the tape measure. In each quadrat, I will identify the species of plant in it with an identification key, then estimate the percentage of which it covers and record it. After I have successfully done this, I will stand in the quadrat frame, look up through the toilet roll tube, and calculate

Lab Report - In this lab report, it will describe the weight of the bob, the displacement and the length of the string of how each factor affect the period of a pendulum.
Lab 3 - Pendulum Introduction: The pendulum consists of a string that has something hanging from the end. When the pendulum is pulled back and release from a certain displacement, the pendulum will freely swing down to the opposite side by force of the gravity and back. The length of the pendulum is measured by the distance from the point where the string is attached and down to the top of the bob. The period is the time it takes for the string to complete a number of required cycles. The cycle is the motion of the bob from the start point to the extreme opposite and back. The bob is the mass of the end of the string. The displacement is the distance or angle the bob is pulled to the right. In this lab report, it will describe the weight of the bob, the displacement and the length of the string of how each factor affect the period of a pendulum. This includes the hypothesis, methods, control variable, results, data table and the conclusion for each experiment. Apparatus: ? Stop watch ± 0.01 seconds ? Ruler ± 0.05 cm ? Protractor ± 0.5° ? Scale ± 0.05 grams ? Ring Stand with a ring clamp attached ? String ? 3 Rubber Stoppers (Bob) Lab 3 Part 1 - To determine how the weights of the bob affect the period of a pendulum Hypothesis: As the mass of the bob increases, the period of the pendulum to swing one whole cycle will decrease. The reason which could make

Experiment to determine gravity from a spring using analogue techniques
Experiment to determine gravity from a spring using analogue techniques The aim of this first experiment is to examine simple harmonic motion exhibited a mass on a spring. Using data recorded in doing this, the spring constant for each spring can be calculated along with a value for gravity. In the first part of this experiment, the relationship between the period of the oscillations of the spring and the mass of the spring is observed. The period of oscillation of mass on a spiral spring depends on the mass on the spring and the spring constant of the spring. This is given by: Where m is the mass on the spring and k is the spring constant of the spring. Since the period can be observed, and the mass on the spring is known, this part of the experiment is concerned with calculating k, the spring constant for each of the springs used. The spring constant is different for every spring, and is defined as the mass needed to produce a unit extension of the spring (ref. 6). This is calculated by placing differing masses on the spring, extending the spring a certain distance from its equilibrium position each time and timing the time for 10 oscillations of the spring to occur. This is done by using an analogue stopwatch and a ruler to ensure that the distance extended from the equilibrium position was the same each time. The graph of period squared against mass can then be

Experiment to calculate spring constant of 2 springs
Experiment to calculate spring constant of 2 springs This experiment is concerned with comparing the theoretical period of a trolley tethered between two springs and the actual value calculated by experimentation. The theoretical period of the trolley can be calculated using the equation: Where m is the mass of the trolley and and are the spring constants of the two springs the trolley is tethered between. In order to do this, the spring constants for the two masses must be calculated. This is done by attaching one of the springs to a force sensor and measuring the force at distances of regular intervals away from the force sensor. From this, a force against extension graph can now be produced, and the s[ring constant can be calculated using the gradient of this line. This is repeated for each spring in order to calculate the spring constant for both springs. The line given for the graph is of the form, and can be compared to the equation in order to calculate these spring constants. In the second part of this experiment, the trolley is tethered between the two springs used above and is displaced from its equilibrium position a certain distance each time. A photo gate is set up to record the time for the cart to pass through its equilibrium position and this can be taken as the period of the cart. The mass of the cart is recorded, and extra mass bars are added to