Diagram of my initial experiment (taken from http://www.doctronics.co.uk/ldr_sensors.htm)
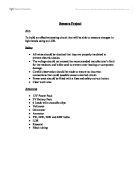
The equipment I will need for the second part of the experiment is as follows:
- Battery pack
- Wires
- Power pack
- Light source (bulb)
- Resistor
- Multimeter
- LDR
This time the multimeter will be set to measure potential difference (and so will act as a voltmeter).
Circuit Diagram 2:
Battery pack, fixed resistor and LDR connected in series. Voltmeter and the LDR connected in parallel. This is a potential divider circuit.
Apparatus Diagram:
Safety
In this experiment, the dangers are only that the bulb could become very hot so there is a small risk of burns (particularly to the hand). Heavy equipment (e.g. the powerpack) could fall and do serious damage to a person’s foot. Also, wires could trip people up, this is in the case of the longer thicker wire that will be connected to the mains supply (the powerpack’s wire). To combat these hazards I shall always pick the bulb up by its wooden pedestal when I am positioning it, I shall keep the powerpack away from the edge of the desk and I shall be wary of knocking it, and I shall ensure the wires are tucked away and off the floor so as not to cause accidents.
Strategy
I am expecting the potential difference to increase the further away the bulb is moved from the LDR. The light falling on the brown ‘zigzag’ lines on the sensor (cadmium sulphide cells), causes the resistance of the device to fall. This is known as a negative co-efficient. Therefore, I know that the potential difference will also fall based on the following equation:
V = IR
Potential Difference = Current ×Resistance
I plan to take 7 values at 3cm intervals: 0cm from bulb (bulb and LDR touching), 3cm, 6cm, 9cm, 12cm, 15cm and 18cm. The resolution of the voltmeter will be 0.1mV for distances of 0-9cm and then 0.01V for distances 12-18cm. I will repeat the experiment 3 times. I shall plot a graph of the averages of all my results, and also a graph of each set of results so I can compare them and note the reliability of them. In this experiment, the best way to represent the data is as a scatter diagram. I considered also taking a reading of the bulb being completely covered. However, from my preliminary experiment I know that when placed completely in the dark the resistance will increase to 1 MΩ or more. To establish a reasonable average resistance I will get more meaningful results by decreasing the amount of light falling on the LDR gently – 3cm intervals. Also, from my preliminary I know that light from other experiments close by can interferes with my own experiment. To combat this I shall use a piece of black paper, propped up by any objects close by to shield our experiments from each other’s.
Preparation
The results the initial experiment gave me were as follows: minimum resistance 55.5Ω, maximum resistance 71kΩ.
Due to the huge range I took an intermediate value: 1.95kΩ.
Results of Initial Experiment (to find average resistance)
In this table the resistance is displayed to 3 significant figures.
To calculate the average resistance I added all three values and divided by 3.
According to this, the average resistance is 2375 kΩ, but because of the magnitude of this I know the resistance I will use will be slightly lower (470kΩ).
Results – Input versus Output (potential Difference)
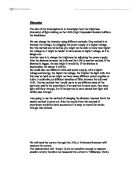
Graph 1 – LDR: Input versus Output
Graph 2 – Input (light) Versus Output (potential difference) of an LDR
The curve was tested by randomly selecting an input value (placing the bulb 25cm away from the LDR) and the result was a potential difference of 59mV.
Problems
Despite the graph of the average output versus input seeming quite good, the individual values are very different from each other. For example, when the light source was 6cm away from the LDR the results were a potential difference of 41.1(UNITS?), 4.9 and 24.0. There is evidently a massive range of results. However, once the average is found the trendline fits the graph with only one slightly anomalous result: when the light source was 15cm away from the LDR the resulting potential difference seems slightly higher than expected. When one noted the individual results themselves it can be seen that on the third run the result at 15cm was considerably higher than expected and this result probably increased the average result. The fact that this individual result in particular was too high may indicate a shadow fell across the LDR from another person or perhaps the natural light became darker at this point.
Conclusion
My results show that as the light intensity on an LDR increases, the potential difference increases. I do not think my results are very reliable as it can be seen that the repeated results are not very similar to the initial results, and the two repeated sets of results are also different from each other. There was a general increase as expected but I do not think the individual measurements are very reliable.
It is interesting to note that my first run produced a straight line of results, the second run a slight curve and the third run a steeper curve. I believe this was because as time went on the resistor overheated more heated up thus changing its resistive characteristics. This could have been combated by using a new resistor each time to ensure conditions stayed the same, or by cooling the resistor to maintain a constant temperature.
The resolution of the instrument was 0.1mV for distances of 0-9cm and then 0.01V for distances 12-18cm. Therefore the quality of the resolution is not very high.
The results were not linear, they were slightly curved. I believe this is because as time went on the resistor overheated and this would have increased the resistance and it can be seen in the equation V = IR that an increase in resistance results in an increase in potential difference.
The LDR did not have a significant response time. The reading changed almost immediately as I moved the light source further away from it.
A factor that may have affected the reliability of my results was the light from other sources fluctuating and changing my results. For example, light from other bulbs in the room (being used in other people’s experiments) and also natural light from outside may change in intensity due to a shift in cloud cover or the change in position of the sun during the day. For this reason, it is extremely difficult to get reliable results when carrying out the experiment in the physics lab.
I believe the sensor is not fit for the purpose of measuring input against output because when I chose to measure the output against the input (bulb being 25cm away from the LDR) the result did not fit on the curve.
The amount of random variation suggests that the system is not fit for purpose.