I have used a scatter-diagram in-order to compare both continuous variables against two factors.
Reasons as to why the Channel Depth and Width decrease greatly between site 1 and 2 are probed into further in the Data Interpretation section of the coursework folder.
- The relation between Velocity and Discharge:
According to the Bradshaw Model, the Velocity and Discharge of the river are expected to increase moving downstream from the source.
Theory as to why this happens is explained in the Applied Understanding section of the coursework folder: points 3 and 5.
I have used an inverted bar-chart in order to compare both variables against one factor.
Reasons as to why the Velocity and Discharge decrease greatly between site 1 and 2 are probed into in the Data Interpretation section of the coursework folder.
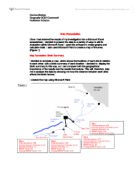
- Bed-load roundness:
According to the Bradshaw Model, the bed load roundness is expected to increase going downstream.
Theory as to why this happens is explained in the Applied Understanding section of the coursework folder: point 7.
I have used pie-charts in order to easily compare and contrast the proportion of different rock types at the five different sites.
Site one (4-Km from source):
Site two (5.2-Km from source):
Site three (8.3-Km from source):
Site four (11.4-Km from source):
Site five (14.3-Km from source):
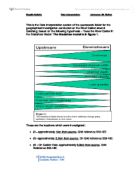
- How the steepness (gradient) of a river changes from the upper to the lower courses:
According to the Bradshaw model a river’s gradient is expected to slightly decrease going downstream.
Theory as to why this happens is explained in the Applied Understanding section of the coursework folder: point 4.
I have used a scatter-diagram to clearly see the change occurring to the gradient’s angle as we move further away from the source.
Reasons as to why the Gradient decrease will be probed in greater detail in the Data Interpretation section of the coursework folder.
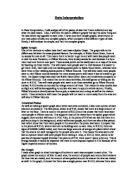
- Comparison of the Bed-load size at the five different sites:
According to the Bradshaw Model, the Bed-load size is expected to decline going downstream.
Theory as to why this happens is explained in the Applied Understanding section of the coursework folder: point 6.
I have used a scatter-graph to clearly compare the b-axis size of different rocks to their site.
A reason as to why the bed-load size generally increases is explained in the Applied Understand.
Reasons as to why the rocks at site 2 fluctuate greatly, some surpassing site 1’s, is probed into in the Data Interpretation section of the coursework folder.
Candidate Number: - 4185
AQA GCSE Geography Spec. B Page