Flats in Chapel Ash -
Pedestrian count
Merry hill was the busiest area with 10 people walking towards the main street and 5 people walking away from the main street. We timed 5 minutes as we counted. I think this was the busiest because the main street consisted of shops and many local businesses this could mean they were going for their shopping etc. You would expect the age to be younger on the inner city as they are the smaller and older houses which may turn out cheaper because land value is cheapest. The ethnicity however is spread. An example of anomalies in my data was the different places we received the information some were on the main streets like for Merryhill and Chapel Ash however Tettenhall we were down a smaller street which hardly any people use. And so we only got 3 for this. This could mean Tettenhall Main Street could be busier. My results don’t fit the Burgess model because of the places we stood to take the count we found that in the inner city it was busier than on the outer suburbs as Chapel Ash and Merryhill were the busiest however Tettenhall didn’t seem to have many people around. And also it was raining quite hard when we went to Chapel Ash and merry hill and so less people would be out however by the time we arrived at Tettenhall it had stopped.
Extension – Secondary Data
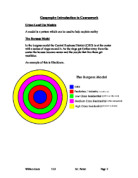
I found out the population density for the 3 areas. I then compared them to the Burgess Model if it fit the Burgess model it would mean there would be more people in the inner city so Chapel Ash and less people on the outer Suburbs so Tettenhall. I found out that Chapel Ash which is the inner city has 1405 people which is lower than the outer suburbs which is Tettenhall which has 1501 and Merryhill which has 1504 people. So this shows the population doesn’t fit the Burgess Model because Burgess predicted population would be most dense in the inner city but this possibly shows that lots of the properties are actually business premises or derelict or empty.
We also did house prices we found the average price of a house in Tettenhall was £331.000 and this was a 4 bedroom house with 2 bathrooms and a garden. The average for Merryhill is £207.000 which was also a 4 bedroom house with 2 bathrooms and a garden and finally Chapel Ash the average house price is £202.00 which is the same size house as the others. This shows the house prices are cheaper inside the CBD moving outwards they rise in price.
Conclusion
Aims:
- What does quality of life mean?
- How does the quality of life vary between the inner city, inner suburban and outer suburban area?
- How does the environmental quality differ between the three areas?
- How does the traffic density and type change from the inner suburbs to the three areas
- Why does the type of person, occupation and wealth differ across the three areas?
- What secondary evidence is there to support my conclusions on government websites?
Housing type and quality
Quality of life is the degree of well being felt by an individual group of people, unlike standards of living quality of life is not a tang able thing. The Quality of life improves the further out you get for example the litter count was worse in the inner city like Chapel Ash but as for Tettenhall there was hardly any. There is also the Quality of housing this also improves in areas like merry hill and Tettenhall but as for Chapel Ash they are smaller and a lot older and the area around it isn’t as clean. The housing type differs in age and the quality improves the questions that I got my information from to prove this were ‘What type of house do you live in’ when was your house built’ and finally’ improvements you would like to see in the area’ Tettenhall is a suburbanised village because most of the residents don’t work there they work in larger area’s and businesses outside Tettenhall. Most of these people live in newer housing and the commuters will use services in the
Centre of the city or in out of town shopping centres. The evidence from the data collection to prove this theory are some questions from the questionnaire we asked the people of Tettenhall ‘ where do you do your main shopping’ and ‘ where do you work’ this proves this theory because most of them said outside Tettenhall. This supports the following hypothesis what does quality of life mean and how does the quality of life vary between the inner city, inner suburban and outer suburban area?
Services
The shops change heading out they are a lot better quality in the inner city the businesses are of a higher class. They have main shopping centres all over the place but the inner city has a lot of middle class and poorer people so they high street shops would be in the centre. On the outer suburbs however the people seem more of a higher class and the shops seem to be a lot more expensive and there are a lot less. There are a range of takeaways in Chapel Ash but not in Tettenhall I think this is because some people in Chapel ash work late and outside of Chapel Ash and so It takes them a while to get back and so it is easier just to pick up a takeaway on the way home.
We asked the people doing the questionnaires if they wanted any more services or changes in the area. In Chapel Ash we had people asking for More facilities for Children and maybe a mother and baby club and also more schools and places of learning. The people of Tettenhall wanted more schools and finally Merryhill wanted places to stop gangs and to make the people feel safer in their own homes they would also like to see more police. This is evidence that the services change in the different parts of the city because Chapel Ash and Merryhill picked up on things for children more facilities but only Merryhill wanted more police to stop gangs. This in comparison with the Burgess Model does not fit as the inner city seems to have everything except schools Merry hill is in the middle wanted protection you would of guessed to of wanted this from Chapel Ash people and finally Tettenhall also wanted more schools. It shows that it is spread about what is needed and it is not all in one place. However this does not fit the burgess model. This does not support the following hypothesis what are the services like for the people living in the different parts of the city? This is because it is more or less the same in each area and I expected there to be lots in the inner city but none in the suburbs. However Tettenhall used to be its own village before the main city suburbanised it.
In a cul-de-sac in Tettenhall -
Environmental Quality
The environmental quality improves moving outward the inner city which is Chapel Ash had the most litter and the streets were dirty and covered in waste moving out however the streets gradually got cleaner we took a litter count at chapel ash on a little side streets we found 60 pieces of litter bearing in mind this was just a side street the main streets were a lot worse moving to Merryhill however also a side street we found 20 pieces of litter the main streets weren’t as bad but there were a lot more bins around in Chapel Ash I only saw one bin and that was on a main street in Merryhill I saw 5 in total. Tettenhall however in the main streets there were no litter the side streets however there were the odd bottle and crisp packet. This shows they are a lot cleaner we came past 8 bins and 5 of them were empty the other 3 were full this shows people must put there litter in the bin and people come to collect it also the streets were clean this could show that people come from the council and pick it up to make it a better place to live.
We also took a traffic count there were more cars in the inner city than the outer suburbs this could mean cleaner air and healthier people, pants and animals. There was 3 times the amount of vehicles in Merryhill than in Chapel Ash and double the amount in Merryhill than Tettenhall this fits the Burgess model as the Burgess model shows the outer suburbs to be a richer place. These results show this as it makes Chapel Ash seem busy and overcrowded whereas it shows Tettenhall to be a clean and healthy environment to be in. This supports the following hypothesis that the environmental quality change in the different parts of the city and it is nicer in the suburbs than the inner city.
A car and house in Merryhill -
Additional Methods
The extra method I did was the population density between the 3 areas it doesn’t fit my original hypothesis though as I thought there would be more people living in the inner city than the outer suburbs. The results were more or less the same and seem to be an even number of people living in the different places. I think as the quality of life changes moving outwards on the Burgess model I think the wealth and health of the people change and there is an even number of people living in each area possibly because there were a lot of terraces in Tettenhall as it is a suburbanised village. Also, around West Park in Chapel Ash there were professional businesses. Like chanted accountants, so people don’t actually live in that house, so they do not count towards the population density.
Extension
To the extent Wolverhampton does and doesn’t fit the Burgess model. Firstly the aspects that do fit the Burgess model, these are things like the traffic going in and out of the CBD in each part of the city we find there are more going in towards the CBD than coming out and there seems to be more traffic in the inner city than the outer suburbs. Secondly the environmental quality there are dramatic changes from the inner city to the outer suburbs this includes things like litter and pollution this fits the Burgess model exactly how I would have though as it is a lot better improved on the outer suburbs than the inner city. On the other hand though things like population density do not fit the burgess model this was my secondary data and so this is unlikely to be incorrect it doesn’t fit the burgess model as if it would fit it then there would be more people in the inner city than the outer suburbs.
Chapel ash -
Evaluation
Improvement – Take traffic count in different streets in each of the areas.
How might these changes change the results? – Well at the moment I took the traffic count data in some places on main streets and others on side streets this could vary the data dramatically and make it unreliable. It could change the results as we may see it doesn’t fit the burgess model at all and there could be more cars in one area than the other. The thing that may stay the same however is the amount of cars going in and out of the CBD I think it will stay the same which is more people heading into the CBD and less people coming out.
Why might these changes happen? – These changes may happen as the data I have at the moment could be seen as unreliable I could try doing all main streets or doing all side streets or even do more than one street in a certain area.
Improvement – Take more questionnaires.
How might there be improvements change the results? – More questionnaires equals more results more results, more results equals more reliable data. What I found is that I didn’t receive much data in the areas where it was quiet like Tettenhall but when I went to busier places I had more people to ask to do the questionnaires. These could improve the results as we would have a range of data in each area.
Why might these changes happen? – If there is more data then there is more reliable results and easier for us to spot anomalies. There could also be different age ranges as I only asked the people that went working and are quite old around 40+ ages I had the most questionnaires from. This could change as the older generation might just have a house with 2 people living in it whereas a family house would cost more this could change the house prices and the house type.
Improvement – Write down the different transport when I took the traffic count.
How might the improvement change the results? – This wouldn’t change the result but it would give more information on the type of transport is used in different parts of the city. There is also the type of cars this could show the type of people going in and out of the city to see what class they are in.
Why might these changes happen? – These changes might happen because the more information the more reliable the results will be.
Improvement – Show the different times of litter found and explain how much of each there was and see when the bin is collected and where the litter seems to be.
How might these improvements change the result? – These improvements wouldn’t change if it fits the burgess model but we would be able to see if the council has daily/ weekly bin collections and see if they are environmentally friendly and they have a clean city. For the different types of litter we would be able to see what could be done about keeping it clean and what is causing it like crisp packets could be down to corner shops.
Why might these changes happen – these changes might happen because the burgess model shows the inner city is a lot dirtier and a lot more polluted and less environmentally friendly than the outer suburbs. If we looked at different places we could see there was just as much rubbish in the outer suburbs than the inner city.
Improvement – Take more pictures to add in my coursework.
How might this change the result? – to look at the actual housing from a primary source could change what you think about the data I have collected like pictures of a certain area you could see if it is clean or not or pictures of a house you could see if it better quality.
Why might these changes happen - these changes might happen because this would be a primary source.
Tettenhall -