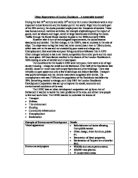
Every sector of east Gateshead is just abandoned land perfect for a clean slate to build sustainable development projects. As listed the advantages of development. The blue part is the commercial areas
Methodology
Questionnaires
Questionnaires are used to get an opinion from all walks of life from children to middle aged people and beyond, questionnaires show is that everyone has a different view point and everyone will have a different opinion on the same subject. Using questionnaires gives us a wide range of opinions and lets us know how different people think about the same subject. We collected 6 questionnaires from various places around the Newcastle Quayside which in many cases isn’t enough.
The questionnaire data will be produced in various different ways depending on the question. The limitations of questionnaires are as follows too little were recorded therefore giving a very inaccurate view on the Quayside and at different times of questioning we would of got a much different view as well as the day, as certain days like the day before the great north run is going to have a slight effect on the opinions on a normal Monday. To improve the questionnaires we could question a lot more people at the different times, places and days.
Traffic Flows
Traffic flow reports are used to give a representation off how much traffic there is at a certain location and time of day. Traffic flows can be looked in three ways a rough guide to how much pollution there is, popularity or how good the road network is around the Quayside. We counted the cars gone passed at a certain road at a certain location for 5 minutes.
The data collected will be put into a bar chart to show the amount of traffic in 5 different locations we visited in the Quayside. The limitations of traffic flows are counting cars for 5 minutes isn’t a fair representation of how much traffic and pollution there is. Also it was taken at one time and on one street which gives us a massive limitation on a picture of traffic inside the Quayside. To improve the recorded information on traffic flows would be to count the cars for longer and to count cars at more streets at a certain location. Also do car counts at different times of the day and different days of the week to give a fuller and better picture of traffic flow in the Quayside. These improvements will also give us a better clue on the amount of pollution, popularity and how good the road network really is.
Pedestrian Counts
Pedestrian counts are used to give us a representation of how popular the Quayside is. This can be looked at as popularity a causes for the amount of vandalism and graffiti about the Quayside. At the certain locations we visited we counted pedestrians for 5 minutes.
This data will be presented in a bar chart to show the amount of people at a certain location on the Quayside. The limitations of a pedestrian count are how long we counted for, 5 minutes isn’t a fair representation of how popular the Quayside is or how much is to do with vandalism. The time of day is important too different people come out at different times and it doesn’t give a fair picture to do it at one time. To improve the pedestrian count you could count for longer and at different times of day to ensure we have a certain picture of how popular the Quayside is.
Car Park Count
Car park counts are used to give us a representation of how many people are using the car parks available and in effect how popular the quayside is. We counted how many cars were in the car park at the certain locations we were situated to.
This data will be presented in a bar chart to show the amount of cars at a certain time and location. The limitation of a car park count is how many people parking in a car park varies with time and doesn’t give a very good view on how many people are in the car park when we only do one car park count for each location. To improve the car park count do it more than once at different times of the day to give a much clearer picture of the number of cars in the car park.
Noise
Noisiness is used to give us a representation of how noisy the Quayside is at certain locations and at certain times of the day. This could be presented as how attractive it is to come here as noise is an indictor of popularity. We stood at the certain locations and used the decibels meter to accurately give us a recording the amount of noise on the Quayside
This data will be put in a bar chart to show the amount of noise at certain locations on the Quayside. The limitations of a noise count is that noisiness is different at different times of the day and isn’t a fair picture of what its really like as some people see different times of the Quayside than others. To improve the noise count would be to do it at different times of the day as it will give us a fuller picture of why people decided to come back or not.
Environmental Survey
Environmental surveys are used to see how attractive and clean the different places around the Quayside are. They show us how attractive a place is and why people would want to visit again. We looked around the different places at certain times and then judged it by how much graffiti is there and how much litter and other unclean things around the area.
The data will be shown in a pie chart to show how clean the different places were on a scale of 1-5 5 being the cleanest. The limitations of an environment survey are different times of the year. Different times of the year give you a different idea of how clean and how much gentrification has taken place. To improve the environment survey would be to do an environmental survey at different parts of the year to see how well it’s being cleaned.
Digital Photos
Digital photos are used to give a picture of how clean and attractive the place really is. People judge a place by a picture and give us an accurate starting point to make assumptions from. We stood at each location and took a picture of the attractive bits and the derelict places.
The data will be shown as pictures with a title of were it is. The limitations are we don’t have a massive library of different years of the Quayside to improve the quality of impressions. To improve the digital photos would be to take photos over a 5 year period.
Sketches
The sketches should only be used in complimentary role with annotations etc. as they convey little info without an explanation, depending on person's artistic ability, only give a basic impression to what they sites look like. Sketches Provide evidence to back-up written notes, are used to provide visual clues/visually explain ideas conveying the regeneration of the quayside.
Land Use Mapping
It assess whether regeneration schemes fulfil the aim to be multi-purpose, are their a variety of land uses? They are used to compare land uses before and after. Has the regeneration changed? The land use of the area, provide evidence of any land-use zoning policies used as part of planning of the Quayside. The problems are its time consuming therefore because of constraints on time available they had to be completed using a data from previous year. Possibly inaccurate, secondary data, unreliable, cannot be identified how it was gathered. Give more time to do the Land use mapping so you don’t have to rely on previous year’s data. I will be using a sector diagram to show the data of land use mapping.
Perceptions
Perceptions identify how close people’s preconceptions are to their actual views after visiting and whether above/below expectations, differences between Newcastle/Gateshead. The problems are personal views only, biased only one person
Secondary Data
Copthorne Hotel Newcastle
The Close, Quayside, Newcastle Upon Tyne, Tyne and Wear, NE1 3RT
The Copthorne Newcastle is a modern luxury hotel
, situated on the city's quayside. Set on the banks
Of the river, this hotel provides modern comfort,
A leisure centre and conference facilities.
Our spectacular location is also convenient to the
Motorway, airport and railway station. Enjoy the
Shops and the many local attractions.
Rooms from £115, 156 in totals
Check In / Check Out
• You may check in from 14:00 hours.
• You must check out by 12:00 hours.
Cancellations
• Bookings must be cancelled 1 day in advance of your arrival date.
• In the event of a no show or a cancellation with less than 1 day notice prior to the date of arrival, an amount equivalent to 100% of the total booking value will be charged
Payment - We accept Courtesy of
• American Express • Switch
• Visa • Diners Club
• Mastercard
The Vermont Hotel
Castle Garth, Newcastle Upon Tyne, Tyne and Wear, NE1 1RQ
The Vermont is Newcastle's only 4 star independent hotel, located next to the Castle Overlooking the Tyne & Millennium Bridges the Vermont boasts an unrivalled position and impressive facade The hotel is a short walk to the main shopping centre, Theatres,Galleries, Universities and Newcastle Central Railway Station. The Hotel has direct access to the Quayside and on site complimentary car parking.
101 bedrooms and suites with classical decor and stylish design throughout, all bedrooms offer maximum comfort.
The Lounge & Redwood Bar offer ample space for relaxation. The Bridge Restaurant has great views over the Bridges of the Tyne.
Seven conference rooms catering from one to one meetings and up to 300 for Cocktail functions.
Rooms from £132 101 in totals
Courtesy of
?hotelid=102956&trkref=MAP&subid=leftlink
Restaurants
At the heart of Newcastle's regenerated, lively Quayside district, Malmaison Brasserie reigns supreme as a superlative place to meet and eat. The highly chic Art Decor French brasserie flooded with natural light has sleek, stylish decor and lovely river views. The staff are passionate about food, wine and service, and the dining room is lit with that brasserie buzz. Malmaison Executive Chef Roy Brett has overall direction, which local chef Gary Cook carries out beautifully.What's cooking? Inspiration is taken from great 'French brasserie-style dishes' and further enhanced with a unique contemporary twist. Dishes include char-grilled ribeye with cafe de paris butter and fine beans and salmon fishcake with parsley sauce and buttered spinach. For those of you with a sweet tooth, be sure to try the tarte tartin with creme chantilly. HI
Newcastle upon Tyne
NE1 3DX
Opening
Mon - Sat 7.00am - 10.00am. Sun 8.00am - 10.30am. Mon - Sun 12.00pm - 2.30pm + 6.00pm - 10.45pm.
Cuisine
Contemporary French
Average Price
£15 to £20
Payment Methods
All major credit cards accepted
Nearest Tube
Dress Code
Le Rivage is the fine dining restaurant of The Copthorne Hotel Newcastle, and serves traditional French cuisine with a modern influence. The hotel is situated on the Quayside with views overlooking the River Tyne. The blue and gold decor gives the restaurant a feeling of restrained elegance and the atmosphere is quiet and relaxing without being 'precious'. A good spot for a romantic celebratory meal or an all-important deal clinching lunch.What's cooking:Tian of melon pearls with seasonal fruit and berries with a port, redcurrant and elderflower syrup; Thai crab broth scented with lemongrass, coriander, chilli and lime leaf; seared king scallops and pancetta with seasonal leaves and hazelnut vinaigrette dressing, cannon of lamb on a minted potato cake with ratatouille, charlotte of aubergine and courgette filled with Mediterrannean vegetables and halloumi cheese, fillet of seabass with a plum and star anise compote and soba noodles, half a baby pineapple filled with a minestrone of fruits and topped with mascarpone sorbet; panna cotta with balsamic roast strawberries, baked bananas soaked in rum with a glazed sabayon. HI
Address
Copthorne Hotel Newcastle
The Close
Quayside
Newcastle-upon-Tyne
NE1 3RT
Opening
Dinner 7.00pm - 10.00pm. Closed Sunday
Cuisine
Traditional French
Average Price
£31.00
Payment Methods
All major credit cards accepted. Nearest Tube Dress Code
Why and how it was helpful?
The secondary data of two hotels and two restaurants around the Quayside is helpful because it gives us a view on what the prices and value for money the general public get, this leads to whether they are successful and whether they are good hotels and restaurants. Hotels and restaurants are businesses and need to show competition to come in a chance of making profit this also benefits sustainable development as people from outside the north-east will want somewhere to stay for a night or two or a restaurant with good food for outsiders or people that live and work in the north east.
Data Interpretation
Where and Why Regenerate?
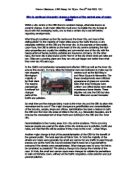
This is a map of the area I am studying Newcastle upon Tyne, The Quayside
Yes this is a map of the Area but it doesn’t explain why we need to regenerate. Below is some old photographs of the Quayside and hopefully images will give a better representation of why we need to regenerate.
As you can see it is so much different to what is looks like now it’s a it’s full of vehicles and ships along the river Tyne and absolutely full of people. It was a perfect industrial city at the time. This industrial city attracted lots of engineers thus creating the bridges across to Gateshead. It accounted for 25% of the total manufacturing production of every nation on the earth. Although it was at its peak industrially the working conditions for awful and the housing wasn’t great either. At the Depression of the 20’s and 30’s the quayside nearly lost 800 years of work. The Tyne and Wear Development Corporation tried to bring jobs and money back to the city and eventually the quayside was becoming an exciting place once again.
Who’s involved and what has been done?
There are many people involved and shown by the picture after this page.
These are pictures of the quayside that show us the change in what the Quayside has untaken
This is a picture of what the quayside looks like now
As you can see the difference between the both are quite great and this is just the beginning.
Economic and Environmental Impacts
This shows us that it was noisiest at 10:10am(69DB) than any other time of the day but does this data link with how many cars were in the car park at the time? It doesn’t look like it but there again is the data we gathered really that reliable?
The pedestrian graph shows us how popular the Quayside is at the times shown. As you can see above the noise level is at 62DB (lowest) when the amounts of pedestrians are at its highest at 60 people. This link shows us that the less noise on the Quayside the more people are attracted to the Quayside.
We took data from questionnaires here are some of the relevant questions and answers
Problems with the Quayside, Litter on a scale of 1-5 1 being no problem and 5 being severe got the average score of 1.78/5 and was thought to of been the least of the Quaysides problems whereas traffic was the major problem having an average score of 2.86/5. This shows that even though the Quayside is not perfect it isn’t a major problem.
As you can see this is the Land use of the Quayside the whole Pie chart represents the quayside. 25% of the Quayside is office’s whereas shops counts for only 3%. Does this account for what is wrong with the Quayside? Does the balance between jobs and commercial use conflict?
This is how many cars had gone past at the certain sites and as you can see site 4 and 5 have fewer than 10 cars going past whereas at site 1-3 in the nicer parts of the Quayside there are lots more cars.
Success
Success can be measured in all different was it can be thought of as a continuum which is a degree of success which can be rated on a line where failure at one side and brilliant success at the other. This data below gives us an indication of whereabouts on the line Newcastle/Gateshead regeneration success really is.
A questionnaire gives us an indication of success from people’s point of view these are the results of them.
46% of people said the Quayside was very good only 1% said it was poor and 23% said it was excellent. This is a very strong indication of success in people’s minds except this data is not reliable. We didn’t ask very many people, to get a clearer picture we would need to ask 1000’s of people but even still if gives us an idea of what people think.
These are the reasons why people chose nicer placer to be, attractive and interesting place puts Newcastle/Gateshead on the map and latest technology.
Over 90& of people wanted more toilets! And nearly 80% of people wanted more bins. These changes are strongly linked to the problems i.e. litter and too many places to buy food and drink while not enough toilets to go to.
Here are some suggestions people made, more seating areas, shelters outdoor cafes, quality retail shops and more public events.
This is the statistics of the three car parks and the number of empty spaces in each. In the Quays Car Park at 11:20am 36% spaces where taken up out of 70 spaces available. In Bill Car Park at 1.30pm only 8% of the 22 spaces where taken up. On the Close swing bridge car park at 2:10pm 42% of 70 spaces were taken up. This is an indication about how popular it is. During 1.30pm not many people were using the car parks. Car parks can tell us either how popular the Quayside is i.e. was it a success? Or whether the car parks don’t have very good paths towards them.
Range of Reasons
As you can see the reasons are mostly positive except for not enough ‘ordinary people’ out of 15 responses. But that one comment has a big significance in itself. Not enough ‘Ordinary People’ it tells us is Newcastle/Gateshead mimicking London and Areas down south by creating lots of cultured places? And do people that come to visit here or come to the quayside weekly like what’s being done?
Here are some quotes from people that we asked to fill in the questionnaire
Personal Opinion
To be honest it’s neither a success nor a failure because it’s incomplete both economically and environmental over at Ovoline oil its still very grotty and economically it isn’t really raking in the money. There is no where to buy things i.e. it needs shops, little shops and small groceries stores to bring in the people so they can spend there money. The Land use map shows this only 3% are shops and 25% of the quayside is Offices. There aren’t any interesting museums to go into places like the Albert Docks in Liverpool have the Beatles Museum to attract people’s intention.
Where environmental development has taken place at Site 1 there were solid stone walls, lots of bridges, a car park, old lamps and a constant flow of traffic we gave it for quality of design, building materials and signposting a 6.3/10.
At Site 2 there were Solid stone walls. Posh lamps quality fitting and expensive brick patterns/road way we gave it a 8/10 based on quality of design, building materials and signposting.
At Site 3 there were solid stone walls, posh lamps expensive fitting, no traffic and good roadway we gave it a 7.5/10 based on quality of design, building materials and signposting.
At Site 4 there were stainless painted bricks, modern area and sign post we gave it a 7.6/10 based on quality of design, building materials and signposting.
At Site 5 there were steel bars, overgrown shrubs, lots of vegetation and foot paths badly managed we gave it 3.3/10 based on quality of design, building materials and signposting.
Generally it was positive accept for site 5 at Ovoline Oil the steel bars were rusty, badly managed footpaths and overgrown shrubs it was obviously not part of the environmental development that has taken place hopefully something will be done. At Sites 1,2,3,4 there were posh lights, good roadways and solid stone walls. Much better than Site 5 and is clear that development has occurred at these four sites.
Judging whether the quayside is a success or not a success?
Value for money (Cost Benefit Analysis)
I gave it a 6/10 for value for money because private owners are making an absolute fortune on the quayside on things like residential areas whereas the public are getting nothing there isn’t much to do the Baltic is not multipurpose there isn’t much to go and to see. It’s not really sustainable a good idea would be to put shops into the quayside so that people could spend their money therefore making more money and keeping the Quayside sustainable.
Aesthetic Design
I gave it an 8/10 for aesthetic design because the buildings are very attractive they pull you in and make you want to see what’s inside of them. Attractiveness is the first perception of the human mind and vital to make money the phrase ‘don’t judge a book by its cover’ comes to mind. Provides multipurpose ideas and creates a warm and a great atmosphere around the quayside vital to bring people in from outside the north-east.
Variety of Function
I gave it a 4/10 for variety of function because there is no real desire to everyone at the Baltic arts centre the culture involved with the Quayside suggests they are mimicking places down south to give it a higher culture atmosphere buts is that what people around the Quayside really want ? There isn’t much to do I mean you can look around the Baltic and go across the bridges but apart from that there isn’t much to do and this is their problem it isn’t multipurpose, the higher culture idea is boring people because you don’t really want to go to the Baltic more than once.
Has it provided employment opportunities?
I gave it a 6/10 for employment opportunities because there have been significant amounts of building work been done to ensure more jobs are made i.e. the Hilton hotel, the bars, the cafes and the new Sage building providing musical outlets for everyone. But it’s the lack of money coming in that stops jobs being created if it isn’t multipurpose where’s the money going to come from?
Has it enhanced the image of the local Area and the north east region?
I gave the enhancement of the image of the north-east a 8/10 because places like the Baltic and the sage are putting Newcastle on the map in a different way to the stereotypical Geordies are portrayed. The high culture is suppose to be only seen down south and putting an Art Gallery and a music centre with a orchestra involved gives the impression Newcastle is a cultural city full of life and potential.
Has it been carried out sympathetically?
I gave has it been carried out sympathetically? A 9/10 because from the looks of the quayside it has really fit in the sage looks fantastic and doesn’t stick out like an eyesore it blends into the modern and old bridges. The new bridges in itself fit in with the older ones like the Tyne bridge and the swing bridge. The lighting that lights up the river just creates a picturesque feel to the quayside and somewhere you would want to be on an evening.
Has it provided for minority groups?
I gave this a 5/10 for minority groups because there isn’t many places where disabled access is available the only one I can think of is the law court this does not really go down well with the disabled population and shouldn’t be overlooked because the Quayside should suit everyone’s tastes no matter who you are and your obstacles you face daily.
Does the regeneration appear to have a sustainable future?
I gave the sustainable future a 7/10 because although the regeneration is clearly incomplete they have created massive of jobs and residential homes always create a foreseeable future of sustainability as well as hotels and pubs. Although there are places like the Baltic and the Sage which I cant see people going to weekly for 52 weeks a year. It’s just impossible most people won’t want to go back to the Baltic for more than once and the Sage wont appeal to everyone as there is a weird arrangement of musical interests involved including African styled musicians and an orchestra which is unheard of in Newcastle.
Did the Quayside Regeneration Scheme achieve its overall aims?
I gave the QRS achieving there aims an 8/10 although its incomplete they are creating sustainable development and creating jobs. This is all benefits of economical developments but not just that its environmental schemes that have widely benefited too like the cleaning up of the river and the making of paths and bridges. Spending massive amounts of money on benches, sculptures and expensive stone walls to make the Quayside somewhere to you would want to be. Although its general environmental schemes being mentioned here what about the buildings that have seen gentrification like the mal maison hotel, the Co-op building and not forgetting the Baltic where it was just a place for birds to rest do you think its any better now?
How does the Q.R.S compare to other similar ‘waterfront’ regeneration schemes?
The London Docks is an example of Q.R.S similar to the Newcastle Quayside. A company called the LDCC (The London Development Corporation) was established on 2nd July 1981. The economy had been wrecked because the docks closed. In three years 10,000 jobs were lost something had to be done. Their strategy was to correct market failures and create rebuild.
Environmentally the LDCC halted the filling of the docks and refurbished the lands to a high quality to open for the public, well funded operations secure management was put into place to insure a long term relationship. It created a ecology park at EAST India Dock Basin The corporation that created the ecology park also went about to create an attractive environment with high quality urban designs, street furniture and open spaces.
The population in 1981 was 39,400 by 1998 it was 83,000 it had grown rapidly since 1981 the number of employers had more than doubled from 1021 to 2690 employment had grown to 85,000 from 27,000 in 1981 and the numbers continue to rapidly go up.
Evaluation and Review
My results and methods may have be influenced by the methods I used and thus the validity of my outcome and therefore giving an obscured result if the validity is flawed. I will assess each method in depth and explain my justification for the answers I have arrived to.
Questionnaires
The method of collecting data, questionnaires is given a 3/5 5 being the most accurate because they were set questions, nothing was changed to obscure the outcome. The effects on the results seem pretty positive I took a relatively small sample and let them express their opinions and viewpoints to get a key understanding of what the public thought. The trouble with questionnaires is that it was only a low sample all were taken inside the Baltic not all over the quayside and there weren’t set age groups as different age groups have very different perceptions and ideas. The balance between males and females wasn’t maintained meaning a completely different outcome to a balanced set of results. The questionnaire results were pretty sound basically because the questions weren’t different and therefore going to only reach a certain amount of conclusions. A bigger sample could be done. It was only done on one day so doing several batches of collection of data on different days of the week would have made the results more accurate and valid. A Gender balance could have been maintained and the amount of the same age group also. These improvements would give a better picture of what people like and dislike on the quayside therefore making it a lot easier to make a conclusion and therefore being able to do something about it.
Traffic flows
The method of collecting data, traffic flows is given a 1/5 because it is always changing depending on what has happened on the streets. The effects are hard to base a conclusion on because what does more cars mean? Does it mean it’s a popular place or does it mean there are lots and lots of pollution? The main weakness of traffic flows was the time spend counting was only 5 minutes can a valid perception be obtained by spending 5 minutes counting? It was only done at 5 times on five roads on one day thus not giving a valid conclusion of the amount of cars on the road generally. It was only done at a certain time of the year are more people going to be out and about in the summer rather than winter? Therefore the main improvement is to do a traffic count for much longer and more counts done on different days of the week to get a clearer picture of what the status of cars that are crossing the roads. Doing more counts on more popular roads.
Pedestrian Counts
The method of collecting data, pedestrian counts is given a 2/5 because it’s always changing like the traffic depending on what has happened in the world or what the weather conditions are. The effects are thus hard to conclude because of what I’ve already stated people tend to only go out when it’s right for them what is happening in their lives that suits them better. Britain work longer than any other country in Europe, so making an assumption from the data given is hard. The main weakness would have to be is the amount of time spent on counting pedestrians as we only recorded for 5 minutes and only at certain times of day and certain locations making it hard to give a full picture. It was only done on one day therefore not being very specific. The amount of pedestrians counted could have been made bigger and done on the busiest places on the quayside as well as the quiet places. The time of year and time of week could have been improved by doing it on 5 different days instead of just the one day.
Car Park Counts
The method of collecting data, car park counts has been given a 2/5 because its always changing like the two above as things change in life and it depends what’s going on, around the quayside. The effects are thus hard to give an answer to because it’s not reliable because different events are happening all the time down the quayside especially at the new opening of the Sage. The main weakness being the amount of car parks counted and it was only done at certain times of day. They could have been improved by doing more car parks at more times of day and on more days because it was only done on one day. Therefore if the changes suggested were made a better outcome would become of it, it would give us a clearer picture of what the states of car parks are in whether they are used or why aren’t they used and a clue to how popular the quayside can be drawn from the information but whether it is valid depends on the amount of data collected.
Noise
The method of collecting data, noise has been given a 4/5 although noise is always changing mostly it has a set db rate as nothing really noisy happens all the time and the noise of people isn’t that loud unless at night when hooligans are let out. The effect on results positive mostly it was quiet even though it was the day before the great north run. The main weakness for noise is that you can’t really know how noisy it is because the state of your ears where you are and depending on what day it is. We only did 5 counts on certain times of day not including night where more noise will be made. The main improvement is to do it at more locations and more times of the week. This would make the perception of what the quayside is like a lot better if the results were more accurate.
Environmental Survey
The method of collecting data, environmental surveys has been given a 3/5 as it all depends how bad the council decide it is and whether they do something about it. The effects on the results were really good apart from Ovoline oil where it was grotty and out of place with the rest although the regeneration of the Quayside is not over it has been a significant change to the Quayside a few years ago. The weakness is that it will change with time and the data given would be pointless because it is only significant to a certain time. Improvements would be to spend a longer time on surveying the area rather than a couple of minutes to get a better understanding on what needs to be done and how bad it really is. Do the survey a couple of times a month to see what have caused the bad things to happen and the good things. Surveying it would make the perception a lot better because 5 minutes is clearly not enough to see what is happening.
Digital Photos
The method of collecting data, digital photos has been given a 3/5 as it can only give a certain outcome of what the person thinks about it whether is good or not doesn’t matter. The effects thus can not really be given as it’s a picture taken at a split second in time and not a continuous picture to see the changes in days months and years. The weakness is the amount of pictures taken is not the whole of the quayside so you can’t possibly make a conclusion from it. The improvement would be to get pictures from every street off the quayside and every building. The improvements would give the a better perception of the quayside via photo graphs.
Sketches
The method of collecting data, Sketches has been given a 0/5 because it really isn’t data and only constricted to the artist’s capabilities. There are no effects on the results because it all depends on the person. The only weakness is how bad the person is at drawing and the improvements would be for the bad person to take art lessons or something.
Land use mapping
The method of collecting data, Land use mapping has been given a 5/5 because the buildings rarely change and if changed they are well publicised if the building is seeking interest. You can’t really say whether its good are bad it depends on what you think is good or bad? Do you prefer lots of pubs or lots of hotels? Do you like the fact that Newcastle is a tourist area for outsiders? The weakness is that it takes too long to do it right so you can’t really get a good representation from what you’ve got. An improvement would be to go into every building and asking what it is if it isn’t already obvious. The land use mapping would be better if the improvements would make the perception of what is need more or less a lot better to interpret.
Another method of data is perception but you cant really comment on the effects, weaknesses and possible improvements because it depends on the person and that person alone and everyone is different so all data would be so obscured getting a reliable piece of data would be near impossible.
I am going to do a SWOT analysis (strengths, weaknesses, opportunities and threats) on the Newcastle/Gateshead Quays and the London Docks this is part of my original work as I have gathered information on the London Docks by myself.
Newcastle/Gateshead Quayside
Strengths
The North-East is always a place people want to be apart of the atmosphere around Newcastle is phenomenal people are always willing to help where they can. Around the Quayside at night all the lights along the Quayside light up, the view is spectacular. The many bridges linking transport routes from Newcastle to Gateshead like the Millennium Bridge and the Tyne Bridge. The night life around Newcastle can’t be beaten with the many pubs and night clubs. It has many hotels to hold the tourism aspect of the city ranging from the Mal Maison Hotel to the Corpe Hotel. The regeneration process has gone really well from creating the Baltic Arts Centre and the new opening of the Sage which is supposedly to have the best acoustics in the world by critics. The jobs made in the process of regeneration has sky rocketed it’s a place people want to come for a good time.
Weaknesses
The regeneration process is incomplete and therefore the best results can not be made, obviously this will change in time. The Quayside isn’t multipurpose the Baltic made a good entrance but it is rapidly losing interesting from the public. The public don’t think its right to have an art gallery in Gateshead. The lack of places to really spend money and places to go during the day gives the Quayside a really bad impression and a place people won’t want to come. It doesn’t fit everyone’s taste therefore less people are interested into coming. The impression people get from the kind of people you get in Newcastle can put people off even though it’s a small percentage that terrorise the place.
Further Opportunities
As the regeneration process is still going they should continue to build on what they have make features multipurpose and genetrificate more places. They could provide more places to spend money and places to go during the day that are interesting and make people want to stay. Make places more disabled friendly to provide better access to more of the public.
Potential Threats
Mismanagement of the regeneration where the buildings are good to go to once but don’t bring in the people once they have spend the time there already. To keep the buildings not user friendly to the disabled public and the mismanagement of advertisement in the new buildings where no one actually knows what’s going down on the Quayside. Creating too many pubs makes too many hooligans wanting to come to the quayside therefore vandalism, graffiti and litter will increase.
London Docklands
Summary
I don’t think the results are that reliable to suggest a correct assumption as it was only done on one day and a specific time you can’t base an assumption on one days set of answers. There was other primary data that would have helped me come to a more accurate conclusion. Unemployment and employment data on the Quayside would help a lot with the conclusion of whether the Quayside is a success it could have been used to state a benefit to the regeneration from figures in 1990 to 2004. Residential prices along the Quayside could have been used to make an assumption of the value of life on the quayside in the residential market. It could have been used to see what the prices of the house compare to 1990’s to the 2000’s to see if there are significant increases of prices in residential areas. The value of the report could be useful to the Newcastle council/Gateshead council and the North East Tourist Board. All companies needing information to suppose there claim of how successful a place is needs a fresh idea or a fresh outlook on the information they have gathered this investigation could be used to give ideas on what to do in future or what do they need to improve on through a person of the publics eyes. Generally my enquiry was successful in giving the right opinion on the Newcastle/Gateshead Quayside as they said it’s good but there is a lot to improve on. From the questionnaires the public’s ideas were clear and precise giving a positive outcome with nobody absolutely hating the north-east. Further enquiries like making the investigation more wide scale, by collecting more data on different days of the week at different times of day and different times of year to give a better picture of what really needs to Improve.