126-130 0 0
131-135 0 0
136-140 0 0
141-145 1 1
146-150 4 5
151-155 2 7
156-160 3 10
161-165 4 14
166-170 5 19
171-175 5 24
176-180 2 26
181-185 2 28
186-190 1 29
191-195 0 29
196-200 0 29
201-205 0 29
206-210 1 30
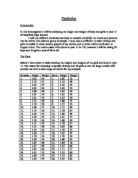
Cumulative Frequency – weight
Weight Kg Frequency Cumulative frequency
30-35 0 0
36-40 1 1
41-45 5 6
46-50 4 10
51-55 7 17
56-60 2 19
61-65 7 26
66-70 2 28
71-75 1 29
76-80 0 29
81-85 1 30
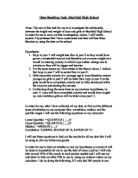
GIRLS
Year Group Boys Girls Total No Of Pupils
7 151 131 282
8 145 125 270
9 118 143 261
10 106 94 200
11 84 86 170
Total 604 579 1183
Stratified sample
Yr 7 131/579 x 30 = 7 (6.7) Girls
Yr 8 125/579 x 30 = 6 (.4) Girls
Yr 9 143/579 x 30 = 7 (.4) Girls
Yr 10 94/579 x 30 = 5 (4.8) Girls
Yr 11 86/579 x 30 = 5 (4.8) Girls
Height cm Frequency Cumulative frequency
120-125 0 0
126-130 1 1
131-135 1 2
136-140 0 2
141-145 2 4
146-150 3 7
151-155 6 13
156-160 7 20
161-165 5 25
166-170 0 25
171-175 3 28
176-180 2 30
Weight Kg Frequency Cumulative frequency
30-35 0 0
36-40 3 3
41-45 4 7
46-50 5 12
51-55 7 19
56-60 5 24
61-65 3 27
66-70 0 27
71-75 3 30
COMBINED
Scatter Graph
Cumulative Frequency height boys and girls
Standard deviation
FORMULA
BOYS GIRLS
HEIGHT
WEIGHT
Analysis
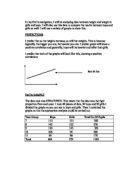
From the scatter graphs, I generally found out that as Height increased, so did weight. This is the case for boys and girls. Both of the scatter graphs show a positive correlation. Thus, this concludes my prediction was correct. As you can see, the line of best fit generally goes in a direction.
This indicates the results are positive.
I worked out that the equation for the boys was y = x + 1.2
And for the girls it was y= x + 1.28. from this I gathered that the boys cut the y axis before the girls and also the boys line was steeper meaning that
On the combined scatter graph, both sets of results showed a positive correlation. I saw that there were more crosses for boys then girls higher up the graph; this indicates that boys had bigger heights than girls.
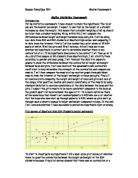
The cumulative frequency curve and box and whisker plots show many interesting results.
For the boy’s sets of height results, I saw that the graph was quite steep. It eventually spread right at the top (as with all Cf graphs) but the middle of the graph was very steep. This told me that the heights were not very spread out around the median.
The box and whisker confirmed this. The box in the middle was not very wide, and the inter quartile range was not huge. The interquatile range tells you how spread out the middle 50% of results are, it is worked out by this equation (interquartile = upper quartile – lower quartile). The upper quartile is the point 75% of the way up and the lower quartile is 25%of the way up.
I also worked out the median by going half way up the CF labelled axis and then drawing the appropriate, adjacent lines. I extended them down from the median onto my box and whisker. I extended the lines for the UQ and LQ to form the box and whisker plot.
As you can see from the graph, the median line is slightly more to the right of the box. This told me that more people were shorter than the median height, ie more people are shorter then 166cm (median) than taller.
From the weight CF graph, I found that the results were not similar to the height results. For example, this graph was less steep; telling me the range was larger. This was confirmed by the box and whisker plot. The box was much more wider. This means the results had a higher range. The box showed the IQ (interquartile = upper quartile – lower quartile) range of the weights was bigger. Generally the wrights were more spread out.
Last of all, I found that the median line was more to the LEFT of the box. This told me that more people had bigger weights than the median weight, then lower than the median.
For the girls, I generally found the same sort of things as the boys. For the height, the graph was also steep and the box was not wide, telling me the IQ range was quite low and that there was a tight distribution around the median. The line was virtually dead centre. So this means the number of people below and above the median, was the same.
Funny enough, the girls weight graph was virtually opposite to their height graph. (Just like the boys height graph was opposite to their weight graph)
The girls weight graph was steeper and the box was much wider. Telling you the ranger was bigger than the height range (same as the boys results!)
The median line also was in the centre of the box, telling me again that the number of people below and above the median was the same.
The combined CF graphs showed me the comparisons in results between girls and boys. For height, you can see that both graphs are steep, indicating a lower range. They both get less steep towards the end because there are less people with higher heights. From the Cf you can see the boys have a higher LQ, UQ and IQ range. They also have a bigger median. All of this tells you that the heights are higher then the heights of the girls.
This is confirmed it the box and whisker. The box is further across for the boys, than the girls. This tells you the heights are generally higher. The box is for the boys are bigger than the box of the girls, telling you the range is bigger for the boys. They also have more people with smaller heights than the median, while the girls have the same number below and above.
Fro the combined weight graph, you can see that both graphs are not very steep, so both have a bigger range. The boys, like in the height graph, have a bigger UQ, a lower LQ and bigger IQ range. This tells you the weights are generally bigger than the girls. This is shown in the box and whisker plot, as the box of the boys is further across. It is only slightly further across, so this tells you that the median etc between the boys and girls is quite close. The LQ of the boys is 47KG while the girls LQ is 45.5Kg and the median of the boys is 53.5Kg while the girls is 53Kg. So as you can see the results are not too far apart.
The UQ of the boys is slightly higher though, and more further across on the box and whisker plot. This is because the boys have bigger weights ( as they are taller than girls and more muscular )
Last of all, the box of the boys is wider than the girls; this indicates and confirms that the boy’s ranges of weight results are bigger. The results are more widespread.
The IQ range and box and whisker had shown me the range of the middle 50% of results. So in order to find the 100% range, I used something called STANDARD DEVIATION. This told me the entire spread of results. As you can see from the working out (in the results section) I followed the formula for both boys and girls, for height and weight. For heights the boys I got 0.300 and the girls, 0.307. The Girls value was slightly higher so this told me they had a bigger spread. This was interesting, considering that the IQ range of the boys was higher than the girls.
For weights, the boys had got 9.83 while girls had got 11.0. So this told me that the girls had a bigger spread, for weights, this was interesting as you would think boys would have a larger spread of weights as they had a larger spread of heights.
In the end my predictions were correct.
CONCLUSION
- As height increase’s so does weight
- Boys have bigger weights and heights than girls
- Girls have a larger spread of results for weights
- Boys have a larger spread of results for heights