I predict from this that the increase of the height bounced should be constant, as should the surfaces efficiency, due to the proportional increase in the graph to show the height bounced by the ball on the different surfaces.
Diagram of prediction
Prediction of graph to show average height bounced by ball on different surfaces
Prediction of graph to show surface efficiency
List of equipment
2 1m rulers
1 tennis ball
1 roll of sello tape
1 retort stand
1 table
A wooden surface
Diagram of equipment
Fair test
To ensure the tests are fair many aspects must be considered especially how particular things will affect the dependent variables.
-The ruler will always be fixed to the retort stand
-The same person will always drop the ball
-The same people will always observe where the ball bounces and record the results.
-The ball will be bounced three times at each height to ensure there are no rogue or anomalous results.
-Ensure the wooden surface is stable and flat
Number and range of observations
Three readings will be taken at each height. The heights will increase at 25cm, the starting height will be 25cm then 50cm, 75cm, 100 cm, 125cm, 150cm, 175cm and 200cm. To ensure the accuracy of the results when averaging them any rogue or inconsistent results will be taken again.
Section 3
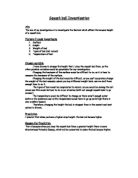
Bouncing the ball on a carpeted surface
Prediction
The rebound of the ball heights will be less on a carpeted surface than on a wooden surface, possibly due to how the carpet handles the energy, which I believe to be inefficient. The carpet should receive much of the balls original kinetic and potential energy.
Detailed and scientific reason for prediction
The balls rebound or bounce can be greatly affected by what surface it is dropped on. When a ball is bounced or dropped, the ball dents. So the surface is partly responsible for the balls rebound. The carpeting should receive much of the balls denting.
Mghb x 100%
Mghd
Eff= hb x 100%
Hd
Eff = output x 100%
Input
The equations are used to calculate the surface efficiency. As the independent variable (in the case of the bouncing balls, is the height dropped) affects the dependent variable (the height bounced), thus making the height dropped and height bounced proportional, as changing one affects the other.
I predict from this that the increase of the height bounced should be constant, as should the surfaces efficiency, due to the proportional increase in the graph to show the height bounced by the ball on the different surfaces.
Diagram of prediction
Prediction of graph to show average height bounced by ball on different surfaces
Prediction of graph to show surface efficiency
List of equipment
2 1m rulers
1 tennis ball
1 piece of carpet
1 roll of sellotape
1 retort stand
1 table
Diagram of equipment
Fair test
To ensure the tests are fair many aspects must be considered especially how particular things will affect the dependent variables.
-The ruler will always be fixed to the retort stand
-The same person will always drop the ball
-The same people will always observe where the ball bounces and record the results.
-The ball will be bounced three times at each height to ensure there are no rogue or anomalous results.
-Ensure the carpet surface is stable and flat, the carpet surface must also be fixed so it does not move.
Number and range of observations
Three readings will be taken at each height. The heights will increase at 25cm; the starting height will be 25cm then 50cm, 75cm, 100 cm, 125cm, 150cm, 175cm and 200cm. To ensure the accuracy of the results when averaging them any rogue or inconsistent results will be taken again.
Section 4
Information from secondary and preliminary work
To ensure the investigation that I carried out was correct and what variables had to be considered. The Internet was used to collect more information. There were many people who had also done something similar to the bouncing ball experiment. There was also an experiment that was carried out with Mr Boye before the investigation. From the first experiment there were many mistakes that I learnt to avoid in the bouncing balls experiment. For example, how the ruler was held up, what ball to use or the one that gave the most evidently process able results.
Here are the results from the experiment carried out with Mr Boye:
I also attempted to research similar investigations on the internet, but only found a few, those that were found were less detailed than the one we performed and lacked some scientific knowledge.
The predictions in section 2 and 3 are drawn, from this previous work and research I have done from the internet.
Obtaining evidence
Results table
Detailed method
Setup of experiment:
-Tape one ruler to the table, and the second to the retort stand. Ensure both are firmly attached, to ensure the results are reliable and fair.
-Place the chosen surface that the ball will be dropped on underneath the rulers, if necessary tape the surface to the floor to minimise movement.
-The ball will be dropped from the heights (cm): 25, 50, 75, 100, 125, 150, 175, and 200. One person should stand to the side of the rulers, to drop the ball. A second person should sit at eye level to the ball, to measure the ball and to ensure the ball is dropped at the correct height.
-This should be repeated three times for each height, to ensure there are no anomalous results and to give an accurate as possible average for the final graphs and possibly a firm conclusion.
-Record all the results, like the table above, and work out the average of each result.
Analysing evidence
Section 1
Graphs
1) Graph to show average height bounce by ball on different surfaces
2) Graph to show surface efficiency
Section 2
Process data and evidence
The graph that shows the average bounce by the ball on the different surfaces shows the ball dropped on the wooden surface and the ball dropped on the carpeted surface.
Both show the general trend that the ball is more or less at a constant. The balls bounce increase at a constant rate. The graph shows that both surfaces display a straight line at a positive gradient. Both surfaces share the same gradient.
The second graph - Graph to show surface efficiency. Shows both lines have different trends. The wooden surface line displays a curve going down, showing lower efficiency in dealing with energy. The carpeted surface line also shows a line which is a curve going up, which may show a better efficiency with dealing with energy than the wooden surface.
Section 3
Conclusion based on sec 1&2
The investigation was carried out quite well, and stayed true to the original method and ensuring that measurements were as accurate as possible; although one or two results may appear to be slightly anomalous. Results obtained could have been better done, more thought should have gone into the plan about making the investigation more accurate. This was only realised when the graph was plotted, and was probably due to my lack of scientific knowledge. They were also as accurate as possible in the conditions; the environment the investigation was performed. But the results recorded, were systematic and clear in the way they were recorded. Even though there was an accidental use of a anomalous result, the trend of the results is still apparent and I may be able to lay down a firm conclusion from the graphs. One of the results undermines my prediction, but the graph that shows average height bounce by ball on different surfaces, displayed the trend I’d predicted.
Relate conclusion to detailed scientific knowledge
Graph 1 or the graph to show the average height bounce by ball on different surfaces,
shows the general trend that the ball is more or less at a constant (with the exception of one or two anomalous results), for both surfaces. The balls bounce increase at a constant rate:
Positive gradient, m y increases at a constant rate y is proportional to x plus a constant equation:
y=mx+c
Graph 2 or the graph to show surface efficiency, shows both surfaces has different trends.
The efficiency of the ball dropped on the wooden surface shows that the trend decreases at a decreasing rate so y might be inversely proportional to x.
The line that shows the ball dropped on the carpeted surface shows a general trend of increases at a decreasing rate; y is proportional to the square root of x.
Relate to original prediction
Graph 1 agrees with my earlier prediction. It is also directly proportional to x, proving that my prediction was correct, in that changing the independent variable affects the dependent variable; as the height the ball was dropped from increased so did the height bounced.
Graph 2 completely undermined my original prediction, this was probably due to the lack of insight I gave to the results and formulas to make and justify my prediction.
Evaluating evidence
Accuracy of evidence
The data from this investigation was reliable as possible at the time it was collected. Though many improvements could have been made, there was one anomalous results collected and included and it did affect the graphs and final conclusion.
The results are quite accurate to a degree, with the exception of the few anomalous results.
The anomalous results occurred were overlooked at the stage where I was obtaining data.
Results only just good enough for a firm conclusion.
Improvement in accuracy
There are many ways to improve the accuracy in the data by changing or improving the way the data is collected, and removing the use of all anomalous results.
Reliability of evidence
The data and graphs that were constructed or collected, should be very reliable, as much of the planning stage was done to ensure all data was consistent the same results should occur if the investigation were to be carried out again.
Anomalous results
All anomalous results that occurred during the investigation were taken again, until the result appeared to be consistent
Support for a firm conclusion
The results that were taken were consistent, in that no anomalous results were recorded and the graphs appeared to be consistent and showed the efficiency well.
Improvements to the method
Different weights or mass, temperature of the ball, using a hollow ball against non hollow ones- which one bounces better, change in ball material,
If the investigation were to be carried out again, some extra apparatus could be used to record different aspects of the bouncing ball. A light gate could be set up to record the speed of going down and the speed when it bounces back up.
The accuracy could have been improved with the use of a digital camera, which could be used to find the exact height the ball bounced; this could be done by replaying the bounce frame by frame.
The investigation should be done in a more controlled environment, to see if room temperature affects the bounce of the ball.
The results will not be completely accurate or precise due to the fact the investigation was not performed in a completely controlled environment, e.g. ball temperature, room temperature.
Additional evidence