I will use box plots to derive how dispersed the data is, how varied the data is. This will allow me to clear relationships between the samples strata.
I will use measure of spread to compare the sample data considering with the same sample but this time excluding all factors.
First line of enquiry
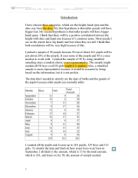
The first line of enquiry is the taller the person the more the person weighs. I will pick a sample of 60 pupils. This is because I think that 60 pupils will be enough to represent the population and it is small enough to manage.
For this line of enquiry, I will randomly select 60 pupils from the school. There are 1183 pupils in the school. I will use the RAN# function on the calculator to randomly select my sample. Below you can see my sample in a table.
The sample above only shows the height and weight because we are not considering any other factors in this line of enquiry. From this, I will now draw a scatter diagram.
From the scatter diagram you can see that there is a positive correlation between the height and weight of these pupils. This tells me that the taller the person the more they will weigh.
Also, I can use my line of best fit to make predictions. The line of best fit suggests that a person that weighs 70kg will be 1.7444m tall. I know this because I replaced the 70 in the formula as ‘x’ and then worked it out. I can also find the height of people that vary in weight.
I will now find the height of a person that weighs 80kg.
If a person weighed 80kg, he will be 1.8214m tall. So, from these two examples, I can say that the more the person weighs the taller he will be.
In conclusion, I have found that the taller the person, the more the person weighs. This conclusion also supports the prediction I made.
Second line of enquiry
My second line of enquiry is to see whether the gender has an affect on the height and weight of the person. For this line of enquiry I will do a stratified sample. I will pick a sample of 60 pupils; 30 boys and 30 girls. This is because I think that 60 pupils will be enough to represent the population and it is small enough to manage.
Stratified sampling is when the population is divided into groups, in this case, year groups. Then from each strata, you randomly select the number of pupils from that year. Below is a table showing the number of boys and girls in each year.
Now that I have this information, I can randomly select pupils from each year group. However, I need to ensure that the numbers of pupils from each year are in the same proportions. Because of this I will take a 5% sample from each year. This is shown in the table below (separated for both boys and girls).
To get these numbers, I divided the number of boys or girls in the year by the total number of boys or girls in the whole school and then times it by 30. I then rounded up the answer I got. I have done this because this is a way of minimizing bias.
I will then randomly sample the number of pupils needed from each year. This means I will have two tables for my sample (one table for the boys and one table for the girls).
I will now draw a scatter diagram including the line of best fit and the equation for both of my tables.
From the scatter diagram for the boys you can see that there is a positive correlation between the height and weight of these pupils. This tells me that the taller the person the more they will weigh.
Also, I can use my line of best fit to make predictions. The line of best fit suggests that a boy that weighs 70kg will be 1.7875m tall. I know this because I replaced the 70 in the formula as ‘x’ and then worked it out. I can also find the height of people that vary in weight.
I will now find the height of a boy that weighs 80kg.
If a boy weighed 80kg, he will be 1.8635m tall. So, from these two examples, I can say that the more the boy weighs the taller he will be.
I will now analyse the second graph which is for the girls. From the scatter diagram for the girls you can see that there is a positive correlation between the height and weight of these pupils. This tells me that the taller the person the more they will weigh.
Also, I can use my line of best fit to make predictions. The line of best fit suggests that a girl that weighs 70kg will be 1.6196m tall. I know this because I replaced the 70 in the formula as ‘x’ and then worked it out. I can also find the height of people that vary in weight.
I will now find the height of a girl that weighs 80kg.
If a girl weighed 80kg, he will be 1.6336m tall. So, from these two examples, I can say that the more the girl weighs the taller she will be.
However, if I now compare these two graph together I can come to the conclusion that the boys are taller than the girls, according to my sample. I am confident in saying this because as I have made prediction with the line of best fits, the height of the boys is taller than the girls for the same weight indicating that gender does affect the height and weight of a person.
So, from this I can conclude that the boys are taller and heavier than the girls. However, I will do the cumulative frequency and the box-plot diagram to further the investigation.
Firstly, I will find the measures of spread (mean, mode etc.) to analyse my results further.
As you can see from this, I can clearly say that the boys are heavier and taller than the girls. I say this because the mean height for the boys is greater than the girls. Also, the range of the height is smaller for the boys meaning that most of them are tall. The mean height for the boys is also greater then the girls. This means that the boys are taller than the girls. Also, you can see that the mean weight for the boys is greater then the girls. This implies that most of the boys are heavier than the girls. In addition, you can also see that the median weight for the boys is greater than the girls’. This is also implying that the boys are heavier than the girls. So it seems to me, from the measures of spread, you can see that the boys are heavier and taller than the girls.
Now I will do the cumulative frequency. I will do this because; the cumulative frequency can be used to compare two sets of data. I will create cumulative frequency table for the weight of the boys and the girls, and then the cumulative frequency tales for height of the boys and girls. I will start of by doing the cumulative frequency table for the weight of the boys.
Now that I have done it for the boys, I will now do it for the girls.
I will now join both of these tables to make it into one single table.
I will now draw the cumulative frequency graph for the weight of the boys and the girls together.
This graph shows us many things. One of these things is that more girls than boys have weights that are up to 50kg. We can see this because the pink line is above the blue in the graph emphasising that more girls weigh less than boys.
Also, you can see that there are more girls that weigh between the range 41kg-50kg. This proves that more girls weigh less than boys. However, most of the girls and boys are between 41kg-50kg.
From the cumulative frequency graphs, I can also predict the percentage of boys or girls in the school between certain ranges. For example, I will now predict the percentage of boys and girls that weigh between 0kg and 50kg.
From the graph, I can see that 50% of the boys are between this range and 56.7% of the girls are between this range. So, from this I can now predict that 50% of the boys in the whole school will weigh between 0kg and 50kg, and that 57% of the girls in the whole school will be between this range. This implies that there will be a bigger percentage of boys than girls over this range proving that they are heavier than girls.
I will now do the cumulative frequency for the height of the boys and girls. Firstly, I will do the cumulative frequency tables for the boys.
Now that I have done it for the boys, I will now do it for the girls.
I will now join both of these tables to make it into one single table.
I will now draw the cumulative frequency graph for the height of the boys and the girls together.
This graph shows us many things. One of these things is that more girls than boys have heights that are up to 1.50m. We can see this because the pink line is above the blue in the graph emphasising that more boys are taller than girls.
Also, you can see that there are more girls that are between the range 1.60<h<1.70. This proves that more boys are taller than girls. However, most boys and girls are between the range 1.50m<h<1.6m.
From the cumulative frequency graphs, I can also predict the percentage of boys or girls in the school between certain ranges. For example, I will now predict the percentage of boys and girls that are between the range 0m<h<1.70m.
From the graph, I can see that 63.3% of the boys are between this range and 93.3% of the girls are between this range. So, from this I can now predict that 63.3% of the boys in the whole school will be between 0 and 1.7m high. I also predict that 93.3% of the girls in the whole school will be between this range. This implies that there will be a bigger percentage of boys than girls over this range proving that the boys are taller than the girls.
So, from this I can now conclude by saying that the boys are taller and heavier than the girls. This is as I had predicted it.
Now to further my investigation again, I will now do the box plots for my sample.
Firstly, I will use my cumulative frequency curves to find the lower quartile, upper quartile, median and inter-quartile range. Below you can see the table for the weight box plot diagram for the boys and girls.
I will now draw the box-plot diagram for the weight of the boys and the girls.
I will now draw the box-plot diagram for the height of the boys and girls.
In conclusion, I can say that from the second line of enquiry, that gender does have an affect on the height and weight of a person. As I predicted, the boys are taller and heavier than the girls as I have just proved with the sample I have.
Third line of enquiry
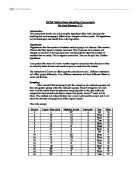
The third line of enquiry is to see whether age has an effect on the height and weight of a person. For this line of enquiry I will again use a stratified sample. However, this time I will only select pupils from year 7, 9 and 11 to minimize bias.
Firstly, I will divide the data into stratum and then randomly select the pupils from each stratum. Again I will pick 60 pupils because it is easy to manage and it is big enough to represent the population.
The table below shows the number of boys and girls in year 7,9 and 11.
I will now do the same method as in the previous line of enquiry and the tables are shown below.
For each stratum I will randomly pick the pupils using the calculator. I then put my sample in the form of tables. They are shown below.
I will now draw scatter diagrams for my sample.
From the scatter diagrams you can see that there is a positive correlations between the height and weight of these pupils. This tells me that the taller the person the more they will weigh. In addition, as you can see as the person get older the person gets taller. This is the case for the boys and the girls.
I know this because the yellow points are above the pink points; and the pink points are above the blue points. This is also the case with the girls. This means that the yellow points, the year elevens, are taller than the year nines; and the year nines are taller than the year sevens. So, I can say that as the child, whether boy or girl, gets older, he will also get taller.
From the graphs I can also say that the older they get, the heavier they get. This is also proven in both graphs. As you can from both graphs, the yellow points are furthest to the right, and the blue points are towards the left, leaving the pink points in the middle. This shows that as the child is getting older he is gaining more weight.
In conclusion, I have proven, from my sample, that as the child gets older, he will gain more weight. In addition, the child will also get taller.
Conclusion
I have now completed my investigation at Mayfield high school. I followed the following lines of enquiries: -
- Relationship between the heights and weights of students without considering any factors.
- Relationship between the heights and weights of students considering age.
- Relationship between the heights and weights of students considering gender.
I can now make conclusions and comment on my predictions and the investigation.
I can say without any doubt, that the taller the person got, the more the weighed. This was proven to you by my first line of enquiry. My prediction was also correct.
Moreover, I have proven to you from the sample I had, that the boys at Mayfield high school were taller and heavier than the girls. This was shown to you in my second line of enquiry. My prediction was also correct.
Furthermore, I have also found out that as the person gets older, the person will get taller and heavier. This is shown to you in the third line of enquiry. My prediction was also correct.
Therefore, I can conclude by saying my investigation was a success.